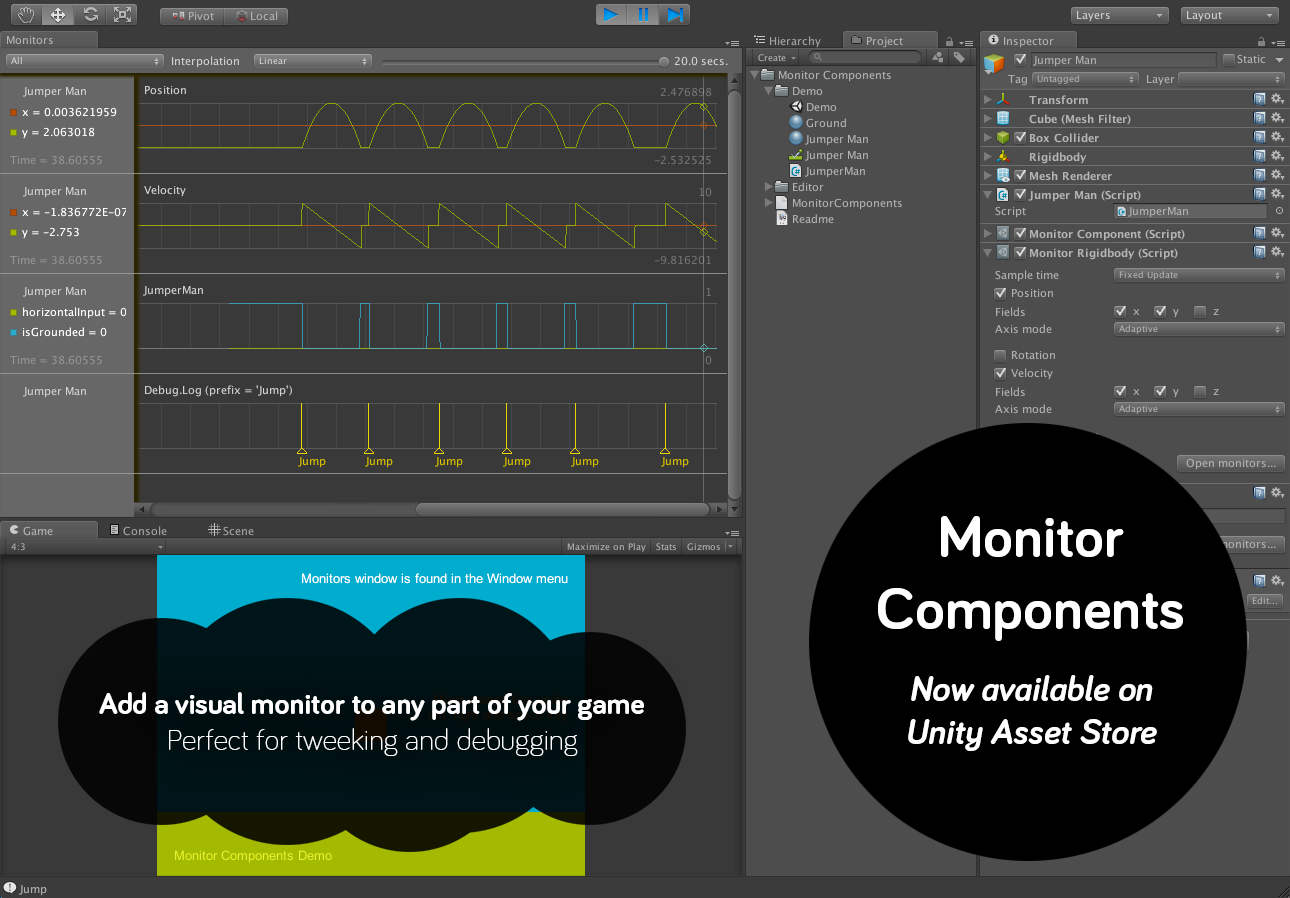
It’s often hard to see what is actually going on in your game when you’re debugging or tweaking code. This editor-extension lets you see and inspect your variables as nice value-graphs over time.
No more using Debug.Log for printing values to the console! Just like an oscilloscope you can attach monitor components to anything in your game. The package includes handy easy-to-use components for Transform, Rigidbody, Rigidbody2D and AudioSource - but you can also monitor any instance variable in your scripts (public and private):
I have implemented this thing several times on different game productions - but this time I have optimized it for drawing-performance, general-purposeness and seamless intergration into the Unity editor.
Great! I just bought it and so far I really like it!
I have a request though: is there a way to keep the graphs from disappearing when stopping the game? A little like with Unity’s own profiler. It’s just that losing all the info when exiting game-mode kind of defeats the purpose of keeping track of what happened…
Another request: Would it be possible to show a grid of vertical lines on the graph that would tell you where the actual frames are located in time? As far as I can see currently there’s only a time counter in seconds which is not as useful as an actual frame counter…
It is not possible right now - because of some Unity editor issues. But it’s on the top of my own wishlist and the first thing I will try to solve for the next update. Until then the graphs are available in pause-mode. Like in the profiler you can pause by clicking anywhere inside the Monitors window.
Oh. I see. Thank you for your reply. I’m not sure if you saw the second request in my post. The one about a vertical grid to see where frames actually happen?
Sorry - I didn’t see you second request. There are some vertical lines right now. When you are zoomed out they show seconds (Time.time) and when you zoom in they show 0.1 seconds. I’m not sure what you need. Could you elaborate?
Sure. Currently the vertical lines are based on seconds. But it would be great to have an option for them to match frames instead. That way you would be able to know the value of a curve at a certain frame. Of course as you zoom out the vertical lines would not be every frame but every 10 frames or more. And when you zoom in the vertical lines would appear until the zoom level can accommodate one vertical line per frame.
Additionally it would be very practical to have a “flying label” appear just over the mouse cursor as you go over the curves like “546 / 2.5” where the first number is the frame number and the second the value on the curve.
I just bought it. It works for public fields on custom components with most native types. Arrays don’t work but it can track the size and version of List and ArrayList.
Wow, this one looks really promising and I will definitely buy it right now.
But will there be any updates like the author said in the beginning of this topic?
It looks like right now you can’t access properties on the base class of a component. It would be very useful to have the ability to monitor derived properties. Especially since there is no source code provided.
I could not find a way to create monitors from code. So here is what I came up with. Hope it helps.
One thing I noticed is numberOfSamples in MonitorInput is really small for logging variables frequently like in a FixedUpdate method. I’ve tried to change numberOfSamples in code but looks like the editor window is not happy about it. It would be great if we can change numberOfSamples. I’ve spent hours to solve this but absence of source code is not helping.
I receive the following error message whenever I open a Monitors window
GetBackgroundInternal is not allowed to be called from a ScriptableObject constructor (or instance field initializer), call it in OnEnable instead. Called from ScriptableObject ‘MonitorsEditorWindow’.
See “Script Serialization” page in the Unity Manual for further details.
UnityEngine.GUIStyle:get_normal()
MonitorComponents.MonitorsEditorWindow:.ctor()
UnityEditor.EditorWindow:GetWindow(Type)
MonitorComponents.MonitorsEditorWindow:Init()
The message then keeps comming when entering and exiting play mode.
I’m using Unity 5.4.0f3
G’day, I’m getting the same error as 2dgame in unity 5.5. Any ideas what might be causing it? I can still work with it but it’s a bit annoying popping up all of the time.
Thanks,
Pete
Frames as x-axis (with snapping?) (someone else has has also requested)
Hover over Debug.Log marks to see what was sent to debug (<— please!). Also black on grey background hard to see, and only first Log. (another previous request)
Maybe click on Debug.Log to show list of Logs and then maybe click again to take you to editor? or to Console line. or maybe minimum click yellow triangle, take you to first Debug.Log line for that frame?
Double click titles to minimise graphs or make ability to scale y-axis down to make them very small?
More than 20secs scale to quickly navigate runtime.