Unknown memory in memory profiler

Hello, I’ve been studying our game’s memory consumption on iOS in the memory profiler and it shows 100MB of unknown data in Unity Subsystems. And another 100MB in as in Graphics.
Is there a way to know what data that is?

Memory Profiler 1.1.0-pre.1
Unity 2022.2.19

Hello :slight_smile:
The
Unknown > Unknown 100 MB are an Unknown because there is some bug in the native Unity code allocating memory in an incorrect way, i.e. one that sidesteps the native memory manager in a way that doesn’t assign a name to that memory. Could you please report that via the Editor menu Help > Report A Bug?

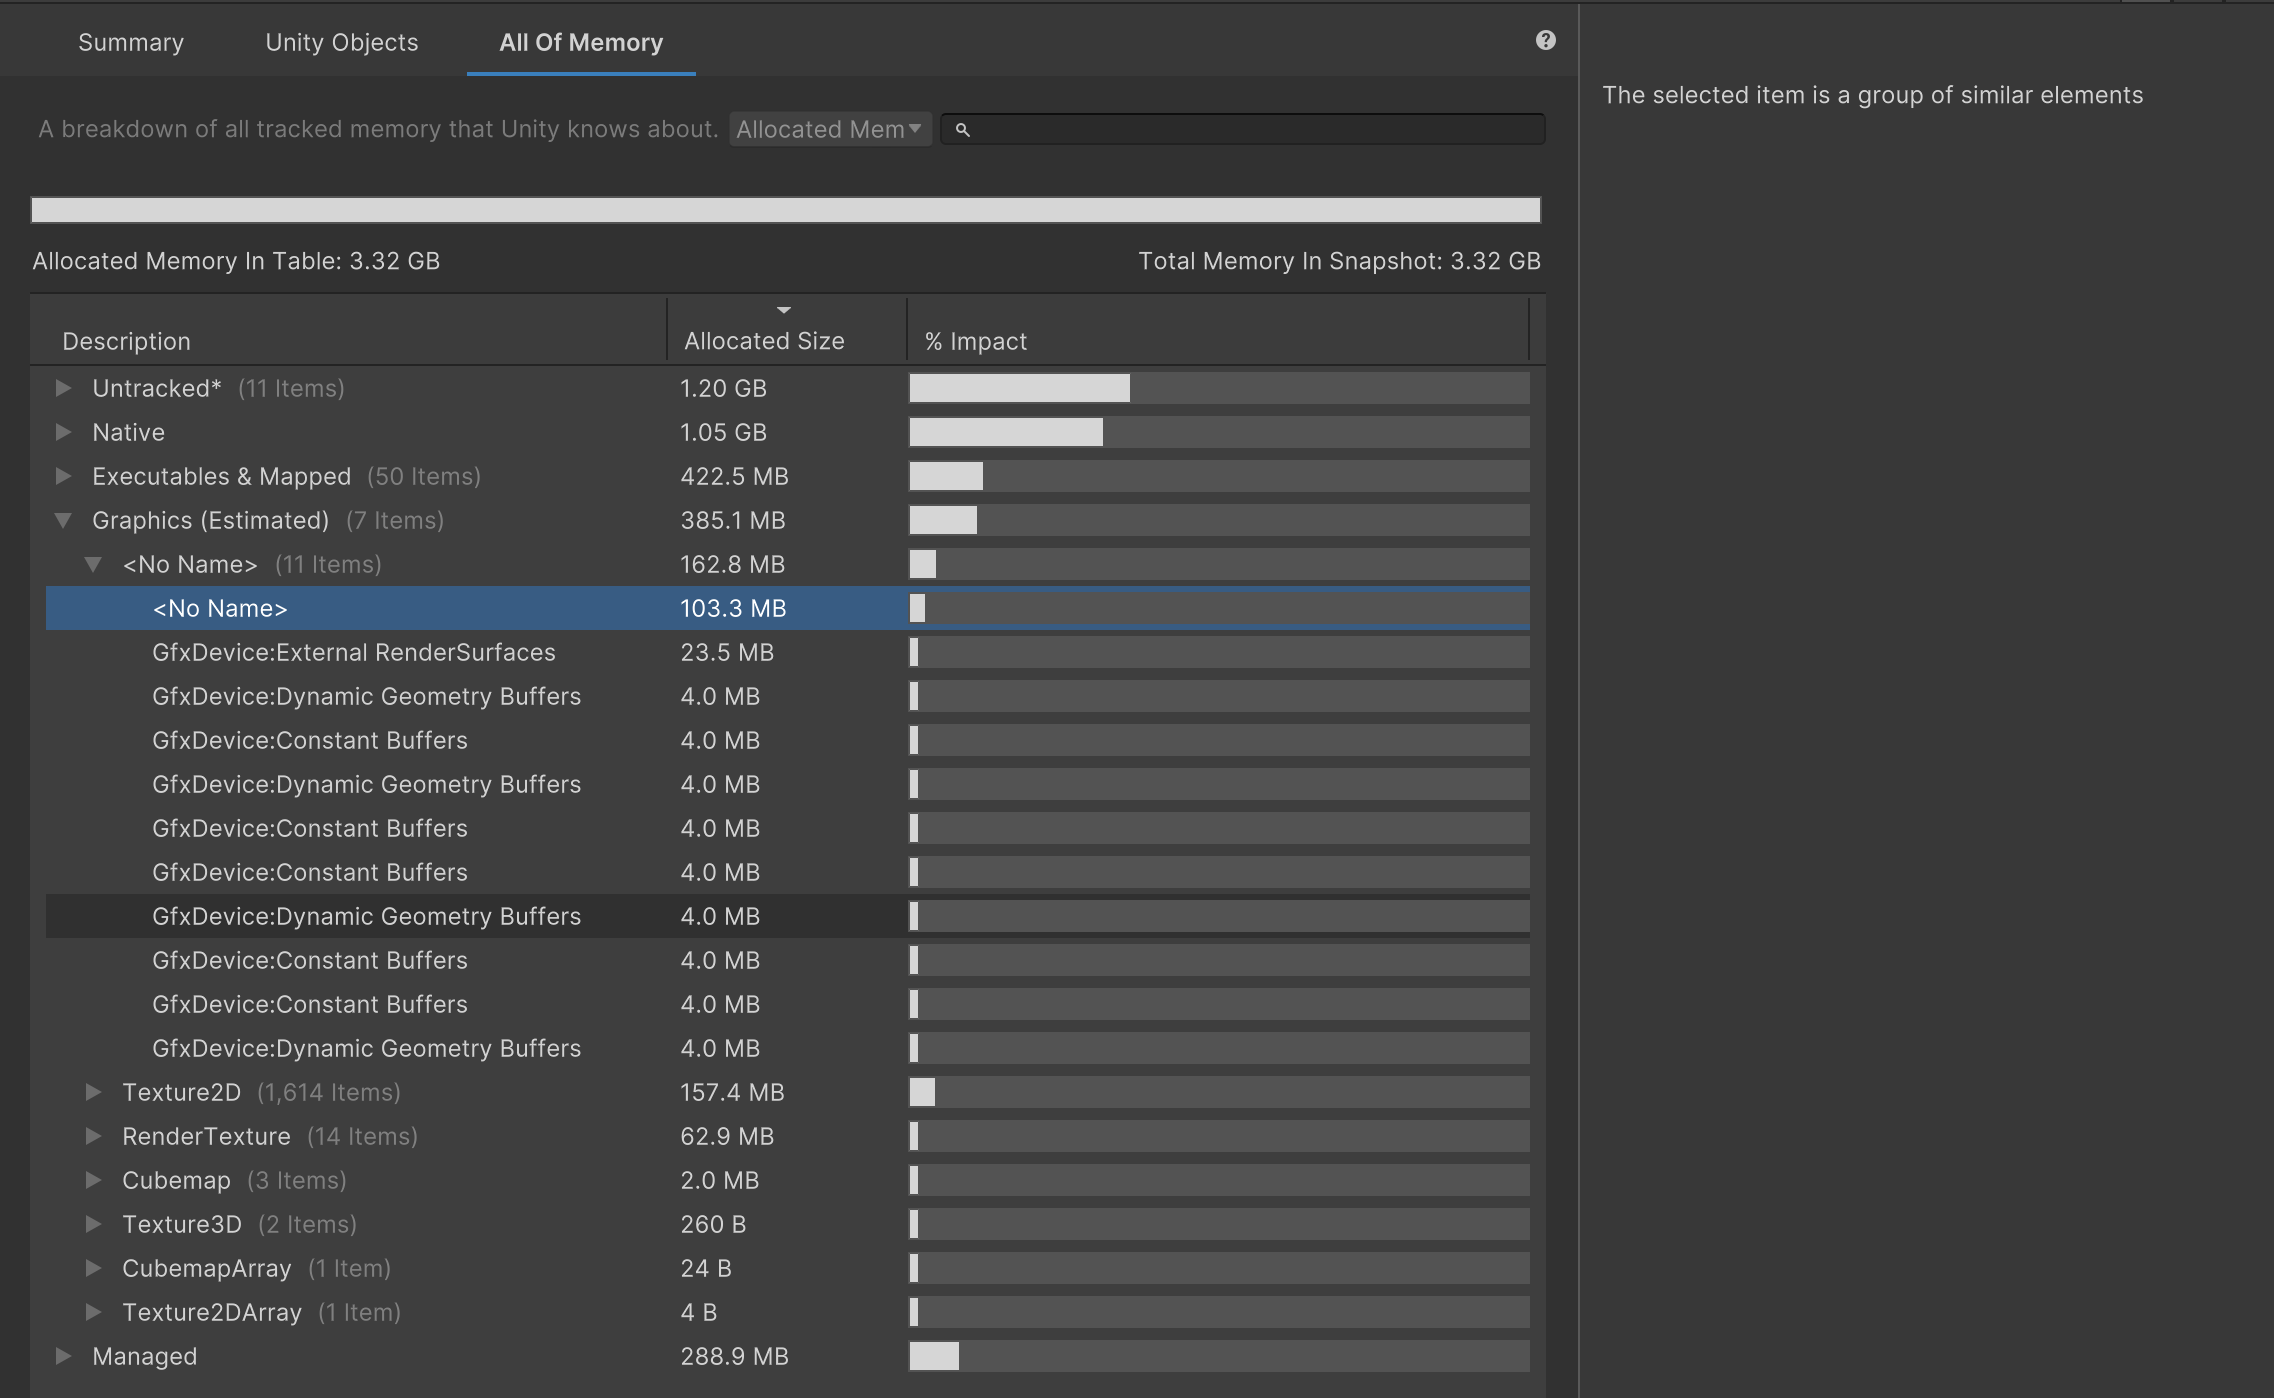
The <No Name> > <No Name> is a bug we’re already tracking, albeit not in the public issue tracker. At the very least, the group should be named “Rendering”. I’m not sure if the item can be named in all cases, as it might just be a graphics Buffer that wasn’t named and depending on where that was created, it’s the package, base unity or maybe your code’s responsibility to give it a reasonable name. So without further info that is a bit trickier to determine.

Note that all my points are about naming this memory so that you would know what it is and if and what you could do about it. Without that info we won’t know if it should be there or not…

Thanks, that makes things a bit clearer. I’ve submitted a bug report as well.

100MB? We have 0.73GB of Unknown memory in profiler! Helpful

Yes, not really helpful and, as stated above, a bug. Could you please file a bug report?

Same. We have 0.68GB of Unknown memory. My Unity version is 2023.2.15.

Please file a bug report via the Editor menu Help > Report a Bug

Was this bug every resolved? And if so, in which version?

Afaik it was never reported and also chances are it’s a separate issue from what you’re seeing so, please report a bug :slight_smile:

I ran into the same (or similar) bug and I tried reporting it, but it looks like it’s already on file over here: Unity Issue Tracker - Part of memory usage is shown as &quot;Unknown&quot; in the Memory Profiler when taking a Snapshot of the Player

No solution yet, but you can give it an upvote if you ran into it too.

Has there been any movement on this, given that bug is still marked as In Progress on the tracker?

I’m running into this issue on a project targeting PS5 and the Unknown subsystem is reported as having allocated 4.2gb just before a crash. I’m trying to track down what is happening to the memory usage as it’s causing crashes in build.

Thank you (and the others that did so) for the bug report(s).

And thank you for your patience. I’ve been working on this since the start of December 2024, expanding our internal tooling to help us figure out where in the code base these allocations are being made, and which teams need to have a closer look at these allocations to determine whether those are leaked allocations that persist even after their root has been deleted, or never had a root in the first place.

There are quite a lot of these, ranging in size from a few bytes up to several KB and they are spread all over the code base. With the new tooling in place, we’ll distribute investigating and fixing these to the respective teams, as their deep expertise of their area in the code base is needed for this.

As a consequence, we’ve split these bugs into multiple (currently non-public) bug tickets per team with the repro projects from the bug tickets for investigation and validation purposes. We will monitor the amount of Unknown Memory (as of version 1.1.9 of the package we call it Unrooted, as that is more accurate and less likely to get conflated with Untracked) as fixes for these land and potentially open follow up tickets, but for now we’ll be closing the existing bugs.

Since this means voting on the bugs is no longer possible, nor is it possible for all of you to follow along on the status of the fix, we’ll move all of that into this thread. We’ll try our best to keep you updated on the status of this here.

We’re roughly looking at getting the worst of this all resolved for 6.5, leaving it up to the different teams if and if so how far they will backport the changes, as they know best what risk would be involved with that, and if any of this was legitimate leaks that need to get their fixes backported.

Interim Workaround
In the meantime, since 6.3 there is the commandline option -enable-memoryprofiler-callstacks which enables calls-tack reporting for (nearly) all native allocations. Unless you built Unity from source, that will currently not symbolicate the native call-stack part, but crucially, it adds MemLabel information for each allocation. So using the package version 1.1.9 and captures taken from Players/Editors started with that commandline option, the Unrooted amount gets broken down by MemLabel to give you at least a bit more insight into what’s going on there.

.

P.S.: The internal tooling is contingent on the ability to modify Unity’s source code, so while the amount of Unknown memory should continuously drop as fixes land, there is still no good way for you to get more visibility on it .

As a quick update here, 31% of the bug tickets we split out per team have now been resolved with fixes landed in at least Unity 6.5. More of them are getting worked on and with some of the resolved ones the teams went beyond their scope and also captured some memory that was previously “Untracked” along the way (so you might see a growth in tracked and rooted memory accompanied with a reduction in the “Untracked” bucket).

We’ll keep working on getting more areas in our code-base properly rooting their memory.