I’m trying to optimize an Android (Oculus Go) app, but I don’t fully understand what the profiler is telling me.
While looking at a fairly busy part of the scene, it seems that I usually get frames in 16 ms, but occasionally there is a 1-frame doubling of that. I assume these are missed frames, where something just couldn’t complete before the vsync, so it had to wait for the next one. I need to eliminate those skips, but I’m still not sure exactly what’s causing them.
Here’s the frame before the spike:
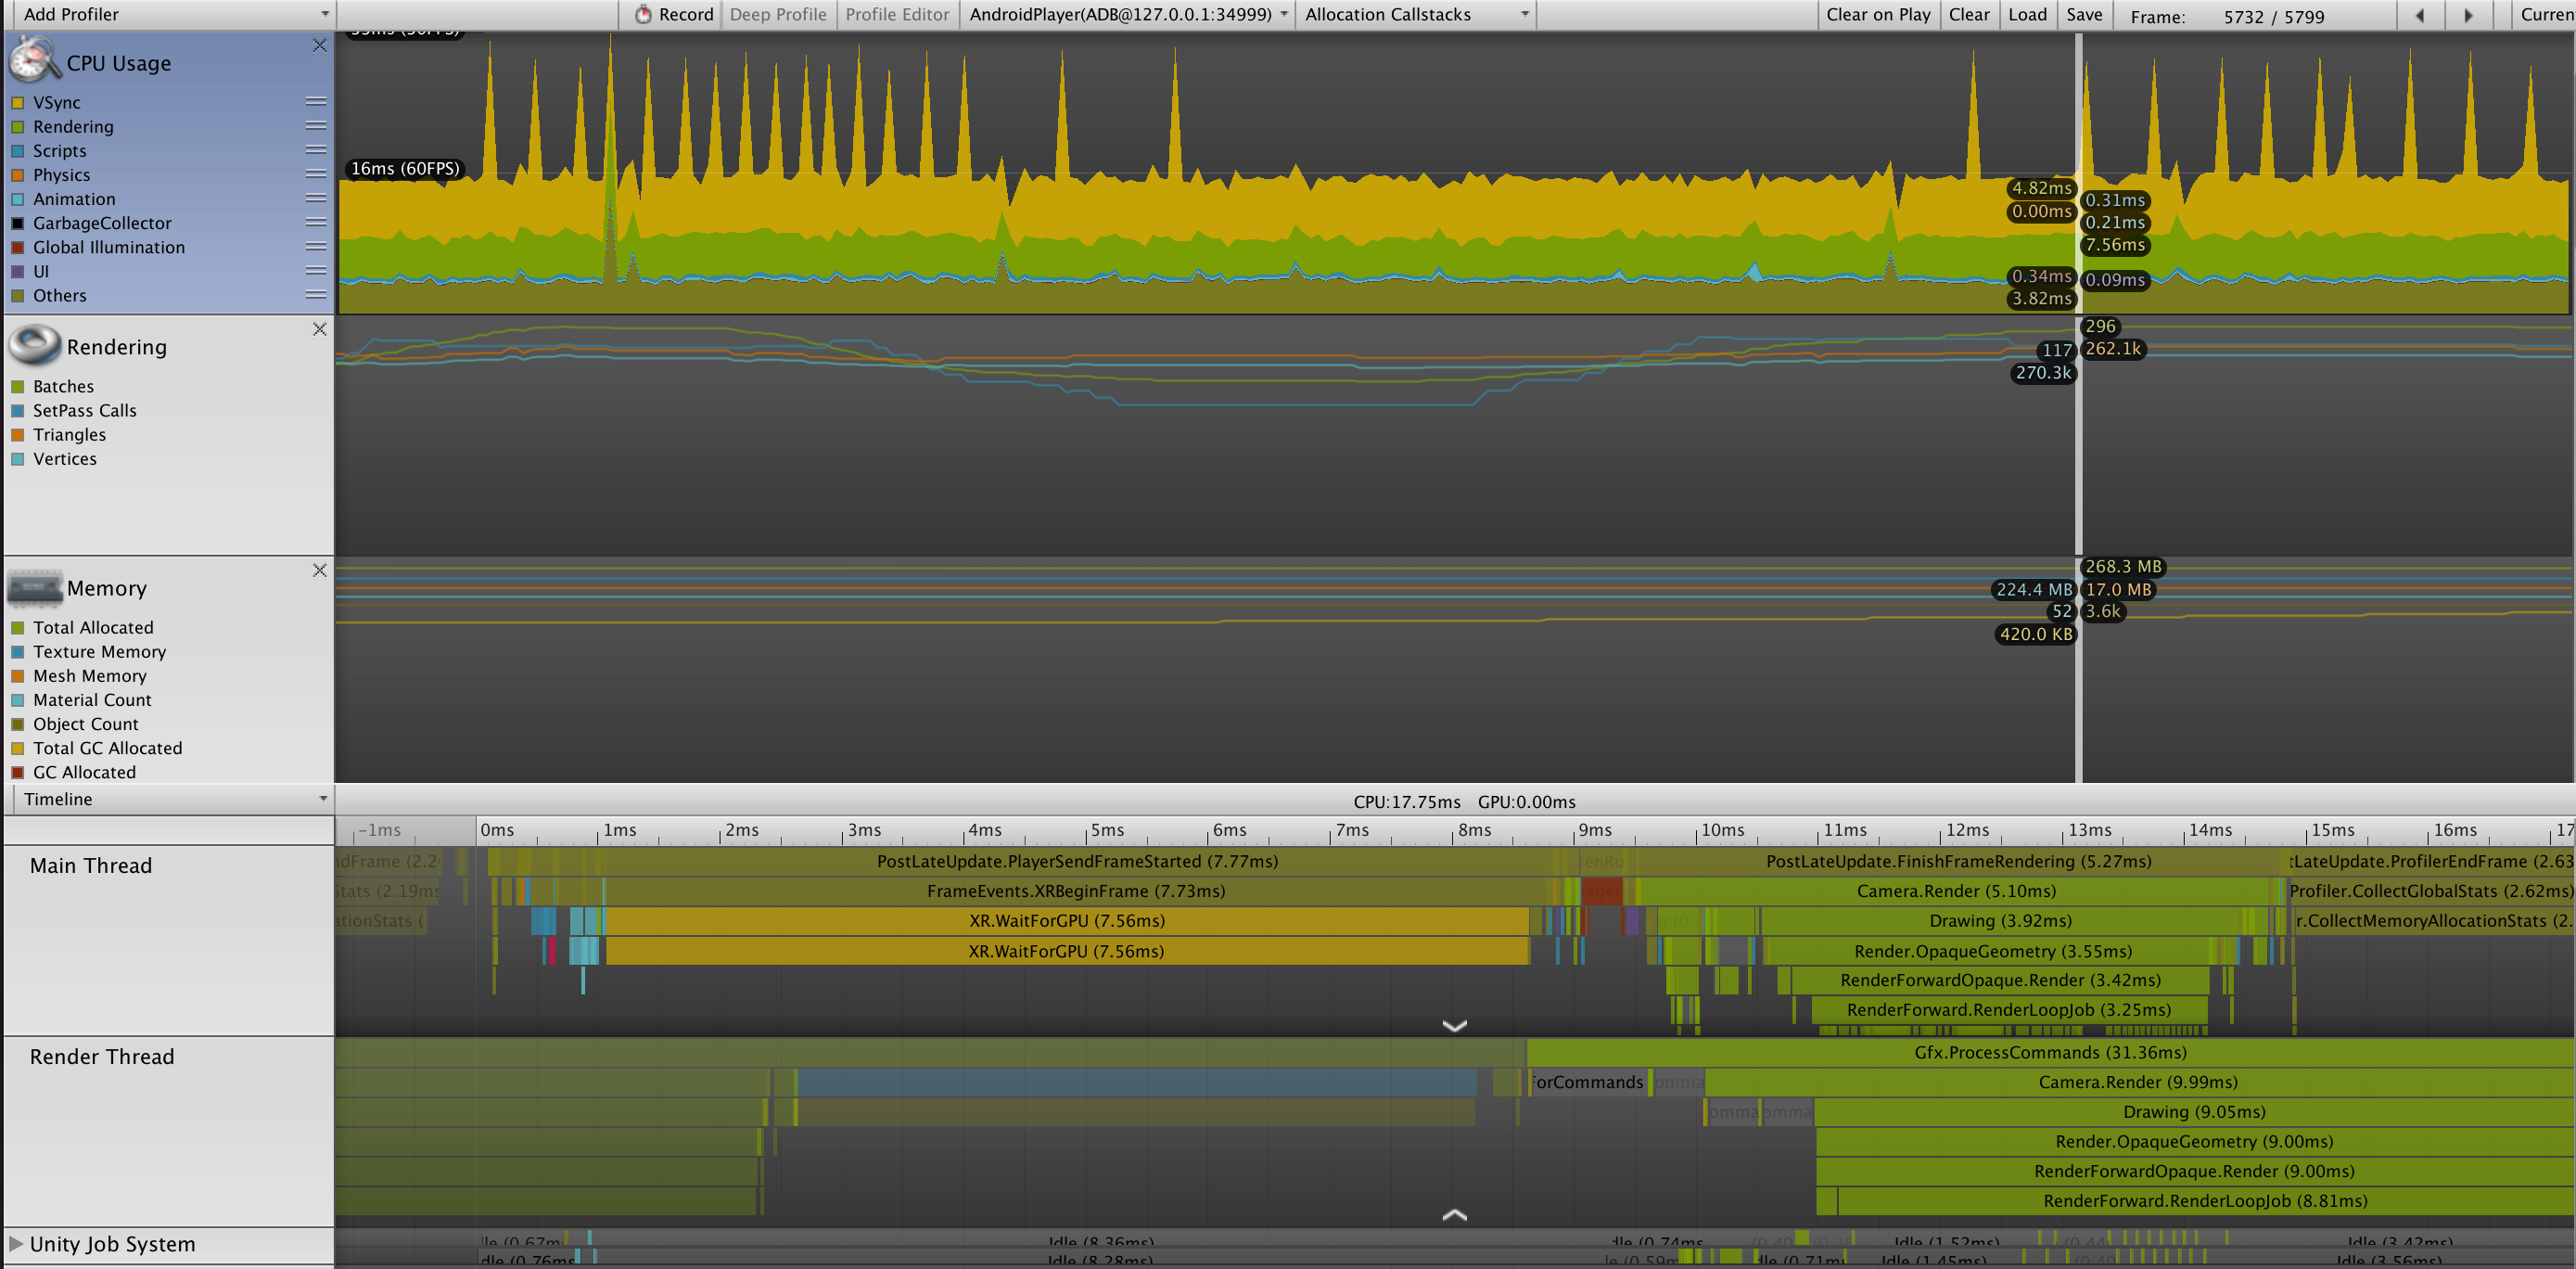
Here’s the frame of the spike, with what appears to be a whole lot of not much going on:

And here’s the frame after the spike:

So I guess the problem is the Render thread, which isn’t starting until 8.5 ms in, and I guess not finishing in time for the frame. But when you look at the graph at the top, the Rendering time plus everything else (except vsync) is always well below 16 ms. And when I compare the pre-hitch frame to any other frame in the middle where it’s getting a solid 60 fps, I don’t see any significant difference — the green bars in the render thread always start around 8-10 ms in, and last for 8 or 9 msec, except for Gfx.ProcessCommands. That one normally takes between 16 and 17 ms, but on the pre-skip frames it takes 32 ms and change. I don’t know whether that’s cause or effect, though.
Do you people who understand these profiler results see any smoking gun here? What should I focus on to prevent these missed frames?


