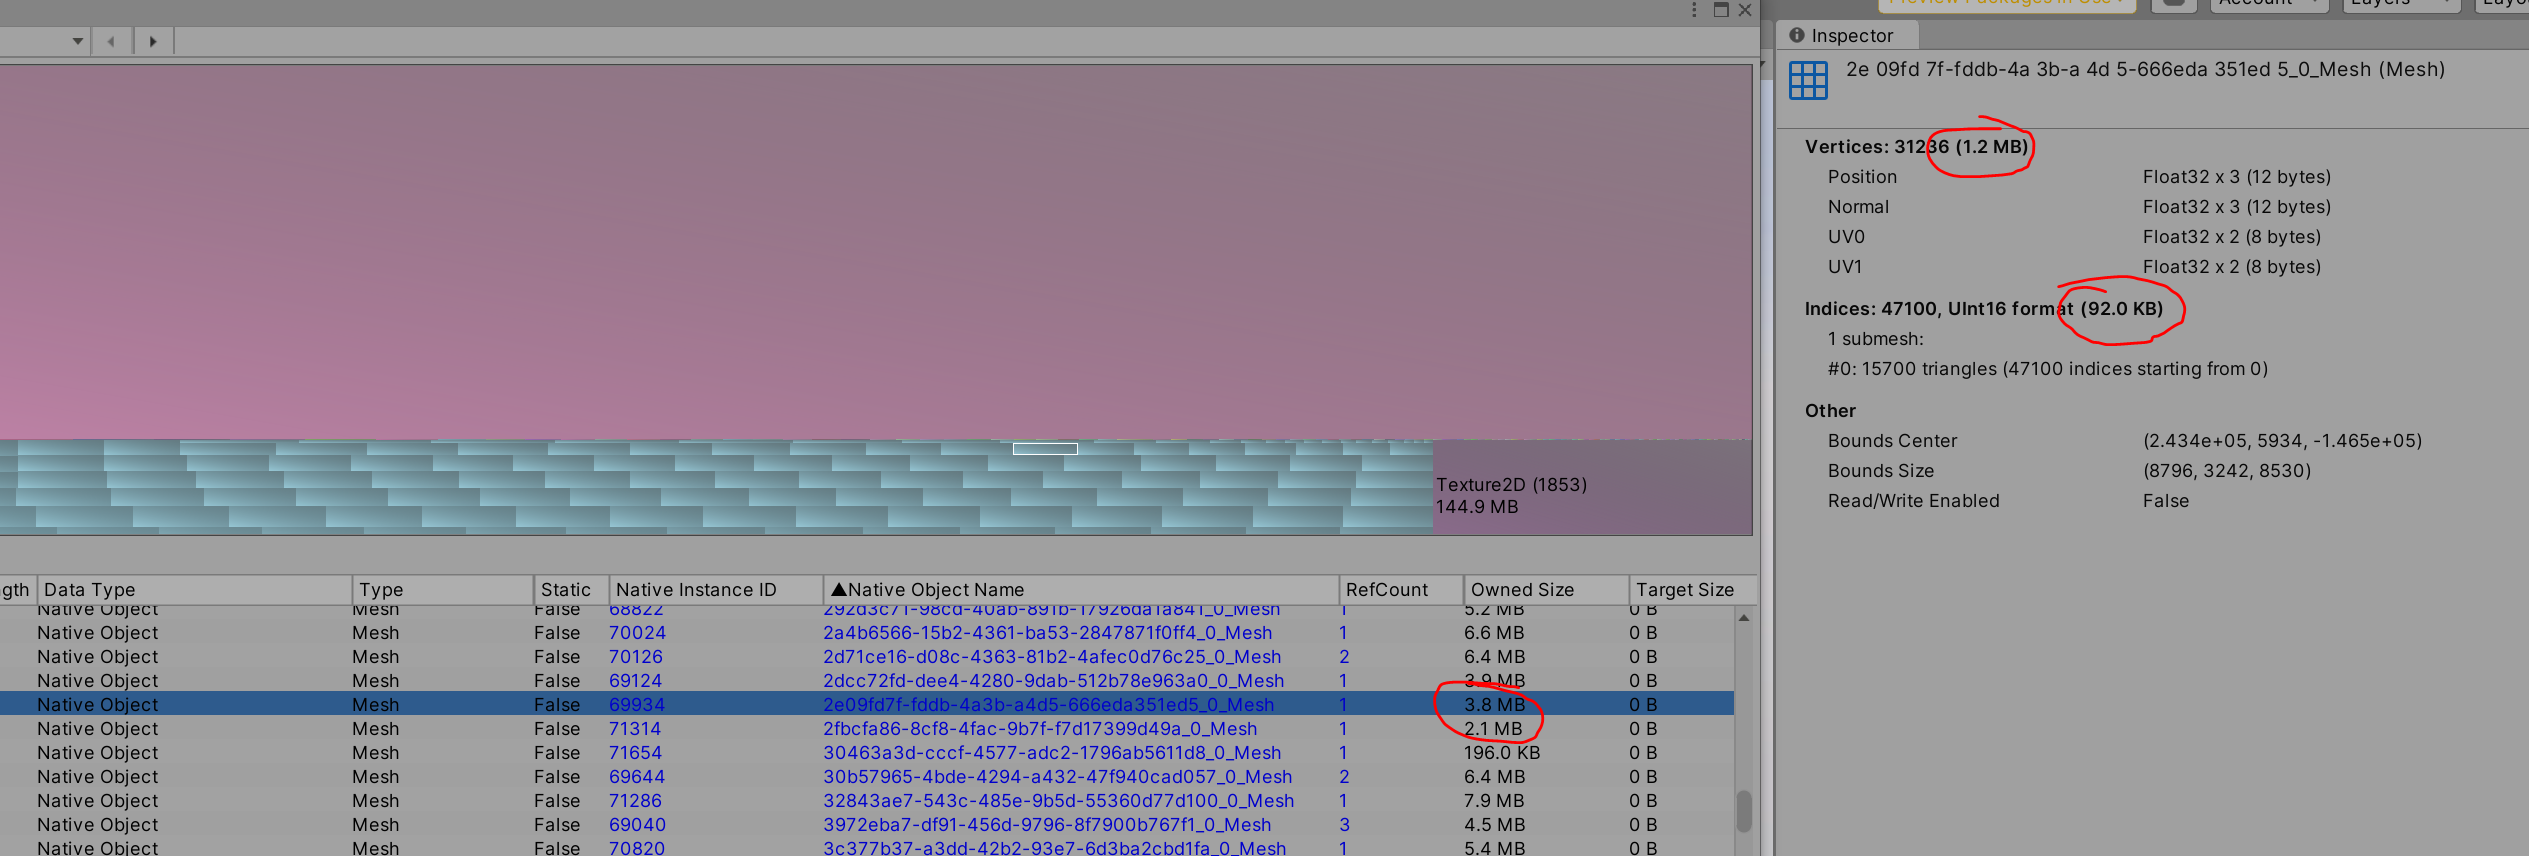
I am looking at the Memory Profiler in the Editor and notice that the of Meshes is considerably larger than it should be, by a factor of 3x.
This is based on our own estimates, and the report of the vertices/indices in the Inspector.
(I have verified in the Inspector that the meshes contain Positions and Normals, and the UV Channels, and nothing else).
This appears to be the case when loading meshes from AssetBundles, and when creating them procedurally.
I have tried to clear the isReadable flag by calling Mesh.UploadMeshData(true), but it doesn’t make a difference.
var m = go.GetComponentInChildren<MeshFilter>().sharedMesh;
if(m.isReadable)
{
    m.UploadMeshData(true);
}
It also doesn’t appear to be an Editor specific issue as I see similar trends in terms of estimated loaded mesh size vs used unmanaged memory in WebGL builds.
A mesh structure in memory in a high performance game engine may be laid out in a way that consumes more (or less) memory than naively multiplying out the components.
That’s why you will not find something in the docs saying “Here is how to compute how much RAM our engine will use for your mesh.”
Odds are it is different on every platform anyway, such as on Mac, PC, iOS, Android, WebGL, Switch and XBox and Playstation.