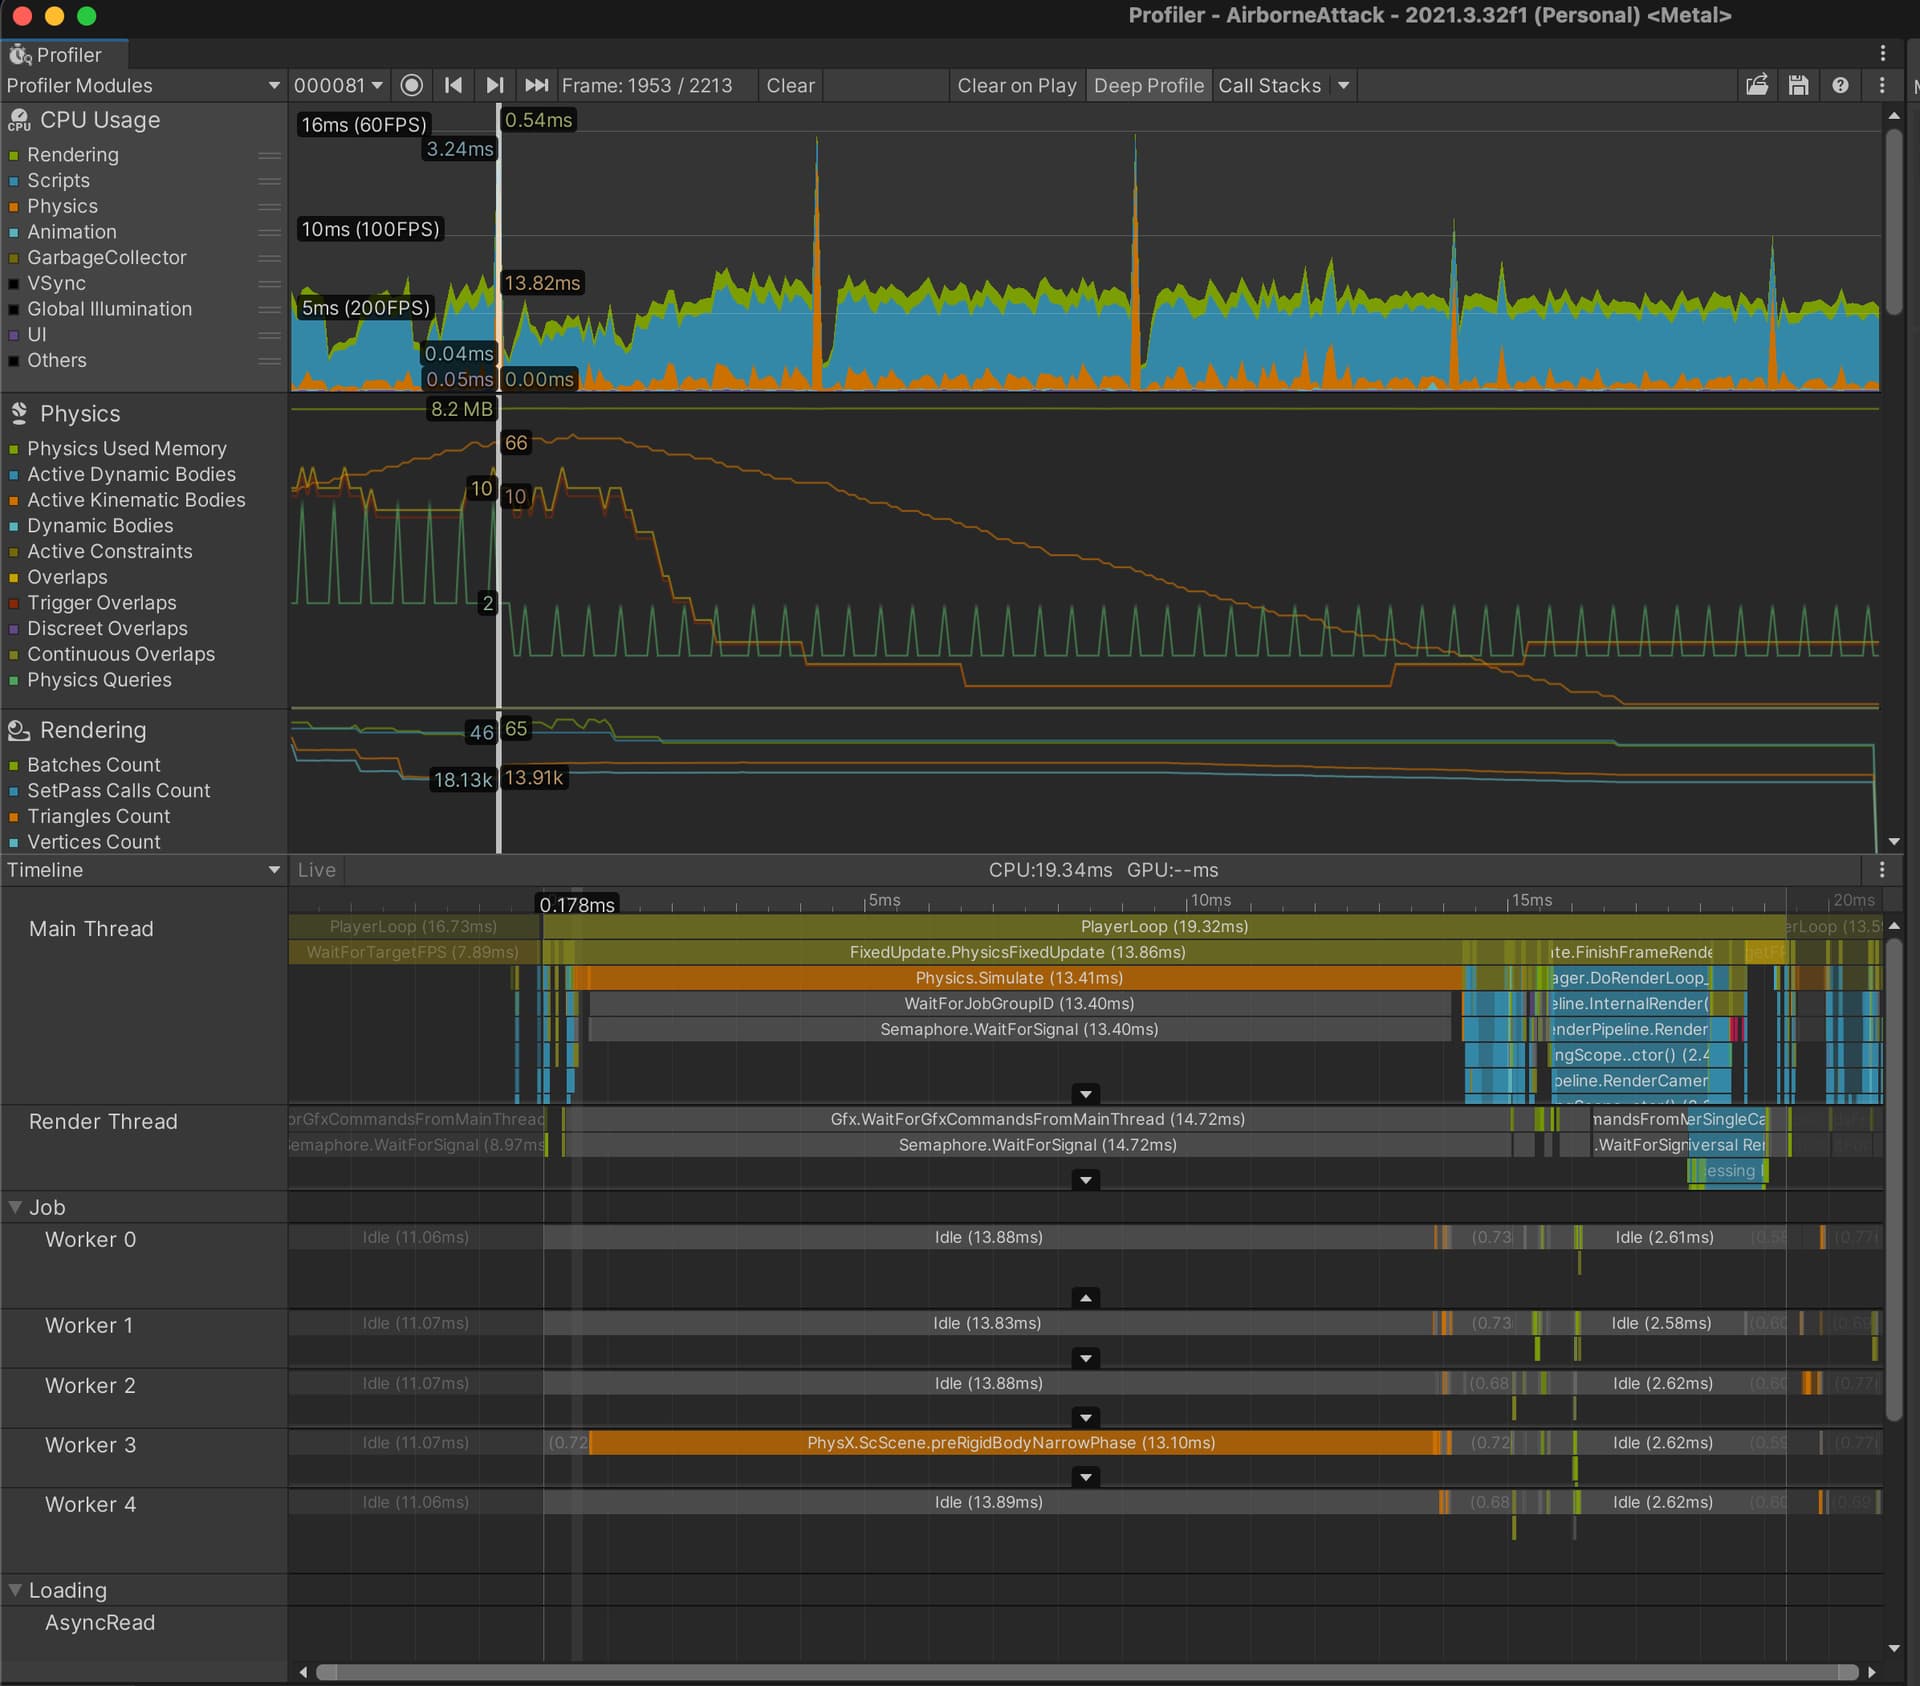
I am optimizing my game and after bunch of improvements I still noticed some spikes which are noticeable by player. Both shallow and deep profiling show same spikes caused by Physics.Simulate, but none of them shows enough information of what exactly takes time for simulation. 2 frames which gave some information are shown bellow.
- Game contains almost no physics, no collisions during spikes, no dynamic bodies.
- No moving colliders without
Rigidbody(only simple trigger colliders with kinematic rigid bodies) - First 2 captures are from the moment when kinematic bullets with trigger colliders are moved using
rb.MovePosition()without any collision and triggering. - Next 2 captures are taken from timespan when no bullet is moving,
- Last one capture no enemies, no static environment colliders are used (meaning that spikes are regular)
- Captures are taken on
iPhone 14 pro, same spikes are noticeable onSamsung A51,Xiaomi
I can provide any necessary detail that can help to solve the issue.
The only markers I could spot so far (if were not Idle on Job workers) that take half or almost all time of simulation were the following:
PhysX.ScScene.KinematicShapeUpdateTaskPhysX.ScScene.finalizeUpdateTaskPhysX.ScScene.rigidBodyNarrowPhasePhysX.DirtyShapeUpdatesTask


Unity Editor version : 2021.3.32f1