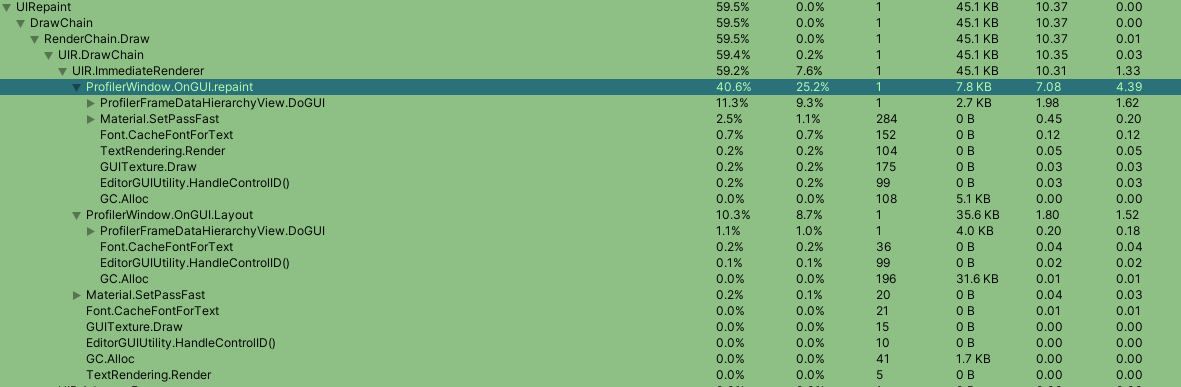
Significant editorloop performance drop when only certain objects are selected in the inspector.

I’ve had this project since ~2017 in roughly similar state and haven’t worked on it actively since maybe around 2018.3.

I’ve updated it to 2019.1 and 2019.2 as they came out but didn’t notice any issues. Now recently I updated it to 2019.3 and I’ve been starting to work on the project again, but if I select certain objects in the hierarchy I get really bad editor lag:

Noticed it in 2019.3.5
I’ve tried backporting to 2019.3.0, but the same issue persists.
And I tried updating to 2019.3.7f but the same issue persists.
I have not yet tested 2019.1 which is the oldest version I still have installed on Hub.
A friend who I’ve been working on the project with has updated to the most recent Unity version and has a much worse CPU&GPU than I do and doesn’t have the issue.

The objects I select don’t have custom inspectors.
And I’m confident this wasn’t the case before, because it’s happening when I select the player object, and in the past I had selected the player object thousands of times during playtesting. Now it immediately drops to sub60 fps in editor when in both play mode & non-play mode.

Not sure how to approach it.

I tested an old old 2018.1 version of the project
updated it to 2019.1 i had installed in hub, and it worked normally
updated it to 2019.2 i had installed in hub, and it worked normally
updated it to 2019.3.0 and the editor performance issue started.

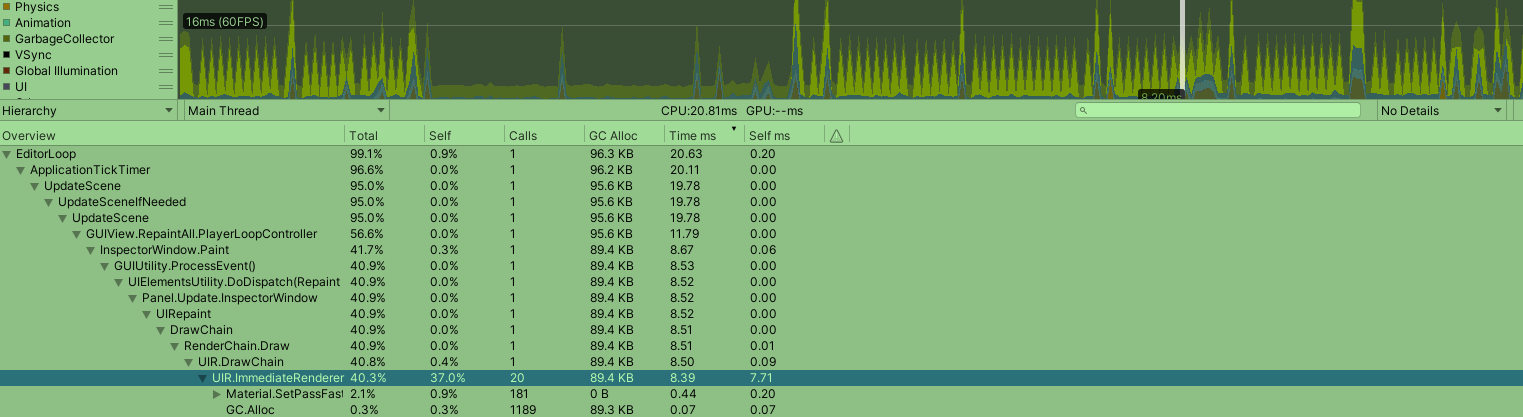
When I click specific objects in my scene, (objects with scripts with no custom inspector), there’s a big editor slowdown as shown in the profiler pic above.

Interestingly enough, if I click on child objects of those objects, then the lag goes away. It’s just these specific objects and I can’t pinpoint a similarity between them.

Just narrowed down the commonality between the objects:

Intense editor slow down ONLY with the inspector open and showing the selected object that has ANY Collider2D type with the Info dropdown menu expanded. As seen here:
5646166--586873--upload_2020-3-29_20-33-21.png

If I minimize the Info dropdown menu, the intense garbage creation and editor lag shown in the original post vanishes.

^ Nevermind. I’m still getting pretty major editor lag, though the info thing definitely changes it from constant lag every GUI repaint to just intense spikes.

I’m seeing the exact same thing.

Trying to view any value in the inspector while the game is running in the editor is borderline impossible. My game lags so bad that it even stops functioning properly. Collision detection and raycasts etc. aren’t working as intended. I don’t even know if this is also highlighting framerate dependency issues in my game or if it’s just straight up broken. I’m leaning towards the latter.

I’ve never seen this in Unity before. I’m on 2019.4.2f1 now.

It gets worse the more components I have open that change every frame, like the transform, collider info, audio source etc., but having something like the player selected as he’s moving around lags the game to death even if every single component is collapsed.

I haven’t looked in the Profiler, but I just looked with Rivatuner enabled and this is how it looks then. Framerate with the player object unselected vs selected:

And I’m not even moving. Nothing is changing as the player is standing perfectly still and yet Unity goes crazy.

I submitted a bug report for this. It’s reproducible in a fresh project by just selecting either the default camera or directional light while in play mode and it gets infinitely worse by adding components like 2D colliders, audio sources or any other components which show realtime data from the game.

Bug report: https://fogbugz.unity3d.com/default.asp?1266360_gtis15hpblpp8l7q

They’re saying they can’t reproduce it when it’s impossible for me not to reproduce it. Any help is appreciated.

This thread may be talking about the same or at least a similar issue for what I can tell: (Case 1158368) Hierarchy window performance degradation

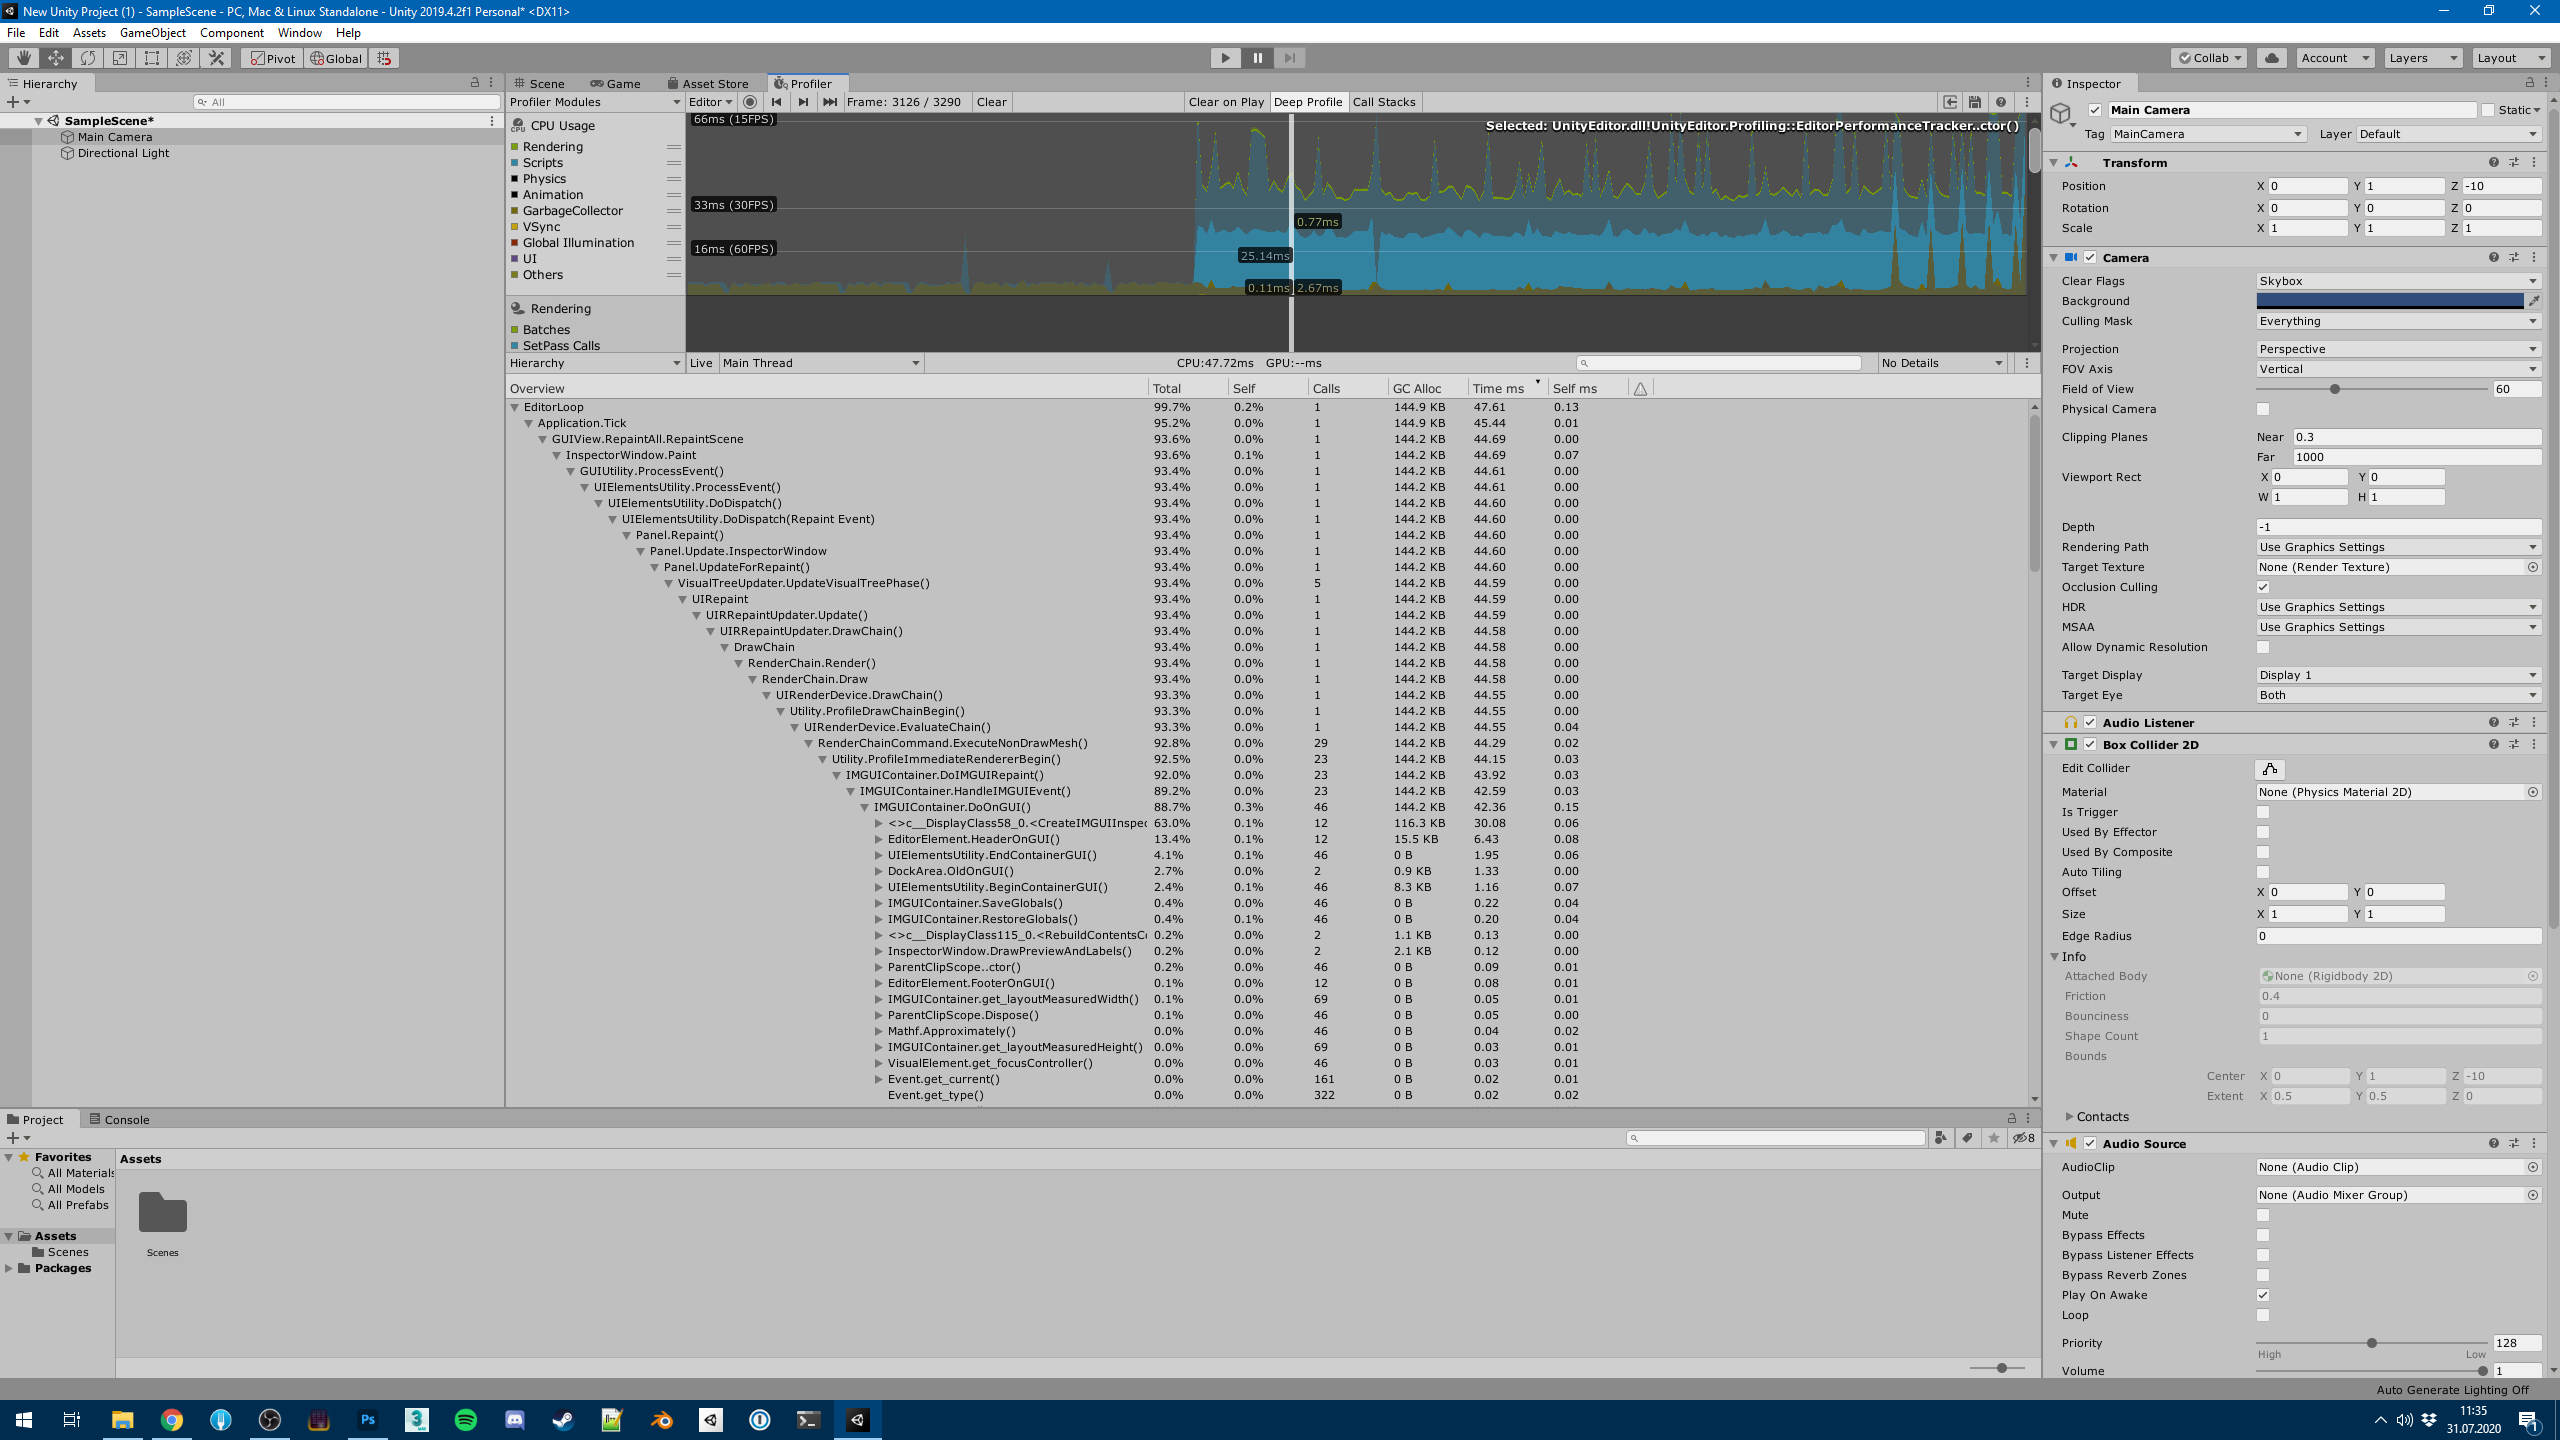
That other thread taught me how to profile the editor and then this is what I found. The first image is with the Main Camera selected with an Audio Source and Box Collider 2D component on it and the second image is with the camera not selected. This isn’t even during play mode as I assume the editor profile just runs continuously as the editor runs?

I don’t really want to get drawn (no pun intended) into inspector GUI performance as it’s far from my area which is 2D physics but I think by adding a BoxCollider2D (actually any Collider2D or Rigidbody2D) and opening their “Info” panel, that causes the inspector to be drawn a little more frequently but it’s controlled by the editor and I think it’s a fixed repaint frequency of 33ms. I did a quick check with some deep profiling and in 2019.4.5f1 it’s there but in 2020.1 onwards it’s not and the difference is how much time is spent in the UI drawing code.

I took a look at the inspector code for 2D physics and found a “Repaint()” in 2019.4 which is probably what you’re seeing for the BoxCollider2D case. I can certainly get that removed but it’s odd that adding it into the 2020.1 onwards makes a minor difference so I think you’re seeing repaint costs because the inspector draw is so slow.

If you open the “Info” panel on the Rigidbody2D in 2019.4 you’ll see periodic spikes which are fairly high but again, these are the redraw cost (every 33ms). The same code on 2020.1 onwards costs much less so again, looks like there’s been draw improvements.

In the end, I don’t see why it’s so expensive but looking at the callstack for drawing the inspector, I’m kind of not surprised as there seems to be a lot going on. Deeper investigation shows drawing a single Vector2 label as 1.5ms which is huge. In 2020.1 that cost seems to have been massively reduced somehow.

I haven’t visited this in awhile, but I do have some more, mostly useless information that probably doesn’t help.

I believe I was wrong when I thought Collider2D/Rigidbody2D played a role in the lag. They do contribute but they’re not the actual problem.

I have two versions of my main project that branched from each other at around 2019.1.
They’re roughly 90% identical except one is the ‘main’ one and one I just made for testing random things and packages and assets I didn’t want to muddy the main project.

My main project is the one with the issue that I brought up with this post after updating to 2019.3. I only just now realized my test project which is what I first updated to 2020.1 a few days ago has the same ‘issue’ but to a much lesser extent despite being roughly the same. To test, I updated my main project to 2020.1 and it still has this issue.

I believe now that the issue is likely due to something I must have done on my end somehow.
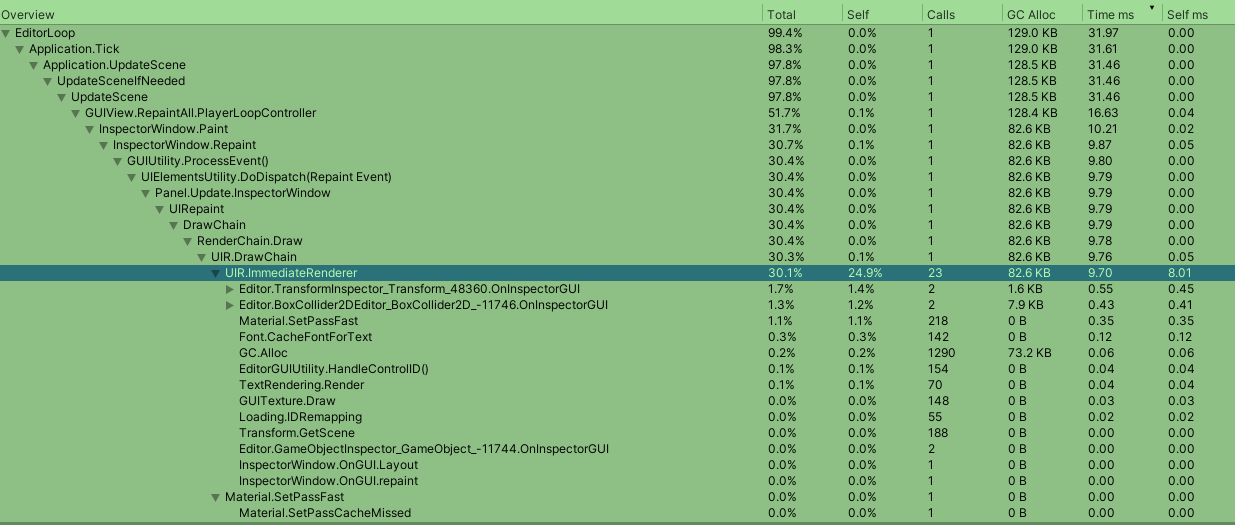
Here is the profiler of my main project again of the significant lag when drawing the inspector with a problem object selected.

In my test project, to clarify, the same problem is actually still there in the profiler, but to a less extent so I didn’t notice it because it never brought me to a noticeably low framerate.

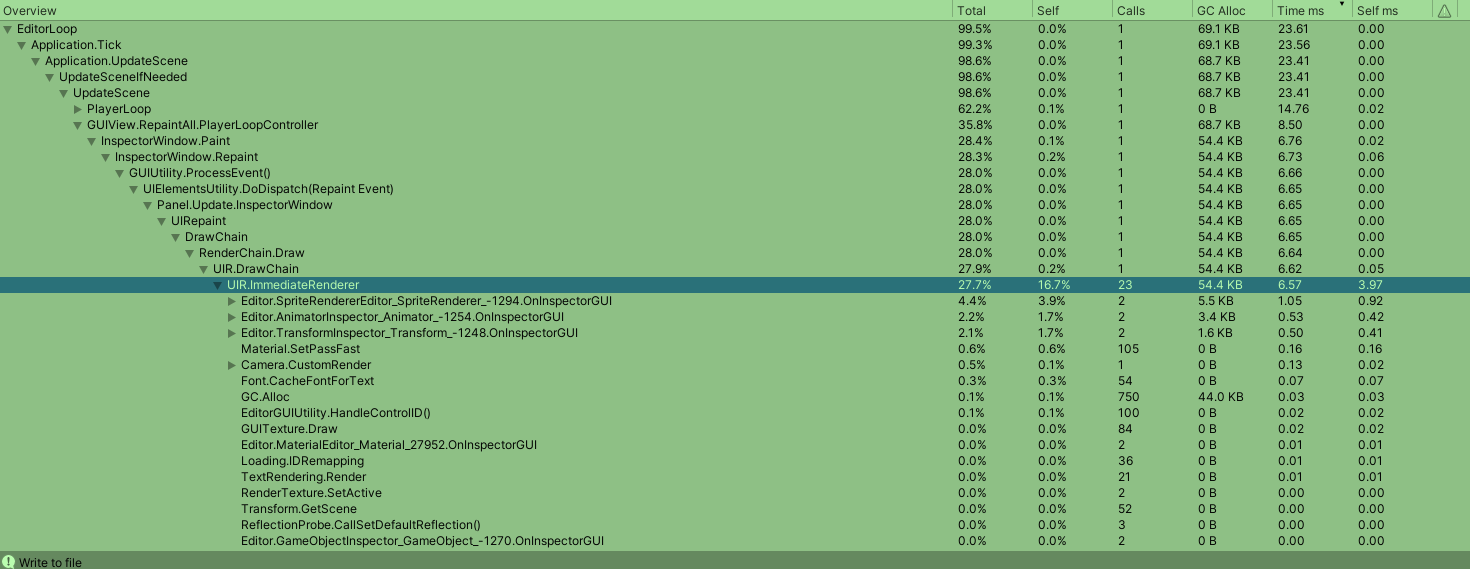
Here’s profiler of test project with same exact object selected in a different but similar scene (which shouldn’t matter because all the lag is coming from editor drawing the inspector).

Important to note that these spikes only occur when one of the objects I’m selecting is changing in some way in the scene, such as transform being updated (in play mode, which happens every frame). I understand that it must be the inspector needing to update values of the monobehaviors and transforms which requires some amount of garbage creation, but what I don’t understand is why it’s so different between my two projects, and why updating to 2019.3 originally caused such a significant drop in performance that 2020.1 didn’t fix for me. And again the backup versions of the project (that are 99.9% identical) that open with 2019.1 and 2018.3 and below don’t have the issue at all.

The reason it’s a problem is that when in play mode, this large inspector drawing time of the selected objects is added to the regular playerloop time, which drops fps well below 60. So it makes testing script changes of those objects’ impossible since I have to have them selected to see inspector values, but the fps is dragged to a slow from all the inspector garbage creation which makes it so I can’t reliably playtest anything.

It has to be a mixture of something I’m doing on my end that 2019.3+ handles differently and doesn’t like, but I can’t imagine what. I’m not using any custom inspector script on the problem objects. Not sure what else to do to figure out why.

Minimizing all components including the transform component on the object has some beneficial effect but doesn’t fix the problem.
My issue at least was not reproducible in 2020.1.

I’m hoping a fix gets backported to 2019 LTS because I have no intention of upgrading until 2020 LTS arrives.

Here’s my bug report, which is now closed:
https://fogbugz.unity3d.com/default.asp?1266360_gtis15hpblpp8l7q

And this is apparently the corresponding request for a backport to 2019.4:

I now have a similar bug. If an object has a Rigidbody and the info panel is expanded, it’ll drop the FPS in the game window by 20. Hopefully this does not translate into the full build, since hierarchy selection apparently affects runtime.

We are seeing the same issue in 2021.2 alpha. We’ve been mostly on the latest alpha for more than a year now and this issue has been around all along. It’s getting worse the more complex the objects become so I finally decided to do some profiling and research which is why I stumbled upon this thread.

As far as I can tell this is not related to any specific component such as RigidBody, AudioSource or anything but simply seems more or less correlated with the number of expanded components with changing values in the inspector at any given time. It also seems a bit boosted (as in even slower) if the selected game object is a prefab.

We’ve also experiencing the same issue when going from the game tab to the scene tab and back again. Dropping from around 100 fps to 10-20.

Given that you say this was fixed in 2020.1 (which we were using a while back when it was alpha) it makes me wonder if the fix hasn’t yet reached the non official release streams. (We’ve been on the beta for a while too and the issue was there as well).

Unfortunately since we are using the some of the latest features in URP we can’t go back to a none alpha version to test this.

Just checking you’re not aiming this at me because I’ve commented on a repaint issue with Rigidbody2D and how that was fixed.

I would also add to not fall into the usual trap of assuming this is one issue and discussing “a fix”. I do not work in the editor/UI team so I can only comment on my personal experience using the editor and something I encountered i.e. how slow a per-frame repaint became in the editor when the new UI for it landed. It was what resulted in a bug being reported for that specific component and how slow it made things. In-fact it was that the inspector repaint became much slower and my fix was to use the built-in method of requesting a repaint and letting the editor determine when that’s best.

1 Like

Nah, TwiiK said he was not able to repro this in 2020.1, that’s what I was referring to.

No I do not believe this has to do with the RigidBody2D component and it’s repaint. If anything related a guess would be any component doing a repaint of its updated inspector content. And the more of them doing it the slower it become.

We are seeing some rather big frame drops just be expanding the transform component compared to having it closed.

Did the new editor change from using the old UI framework to the new? Implying a need to wrap old component inspector editors?

Caveat: I’m a 2D physics dev and I’m fairly low on knowledge of the underlying changes but I am trying to help. :slight_smile:

There’s no wrapping of old component inspectors going on AFAIK inferring some performance issues related to some crazy abstractions. For most inspectors they use standard editor layout stuff which then translates into whatever the underlying implementation is. Any that do more were changed to the new set-up. For my part, I’ve only ever encountered rendering issues related to the inspector hierarchy i.e. repaint speed etc.

Like any complex bit of code though, there’s often several factors at play which is why I urged not to fall into the trap of looking for a single root cause (understand I’m probably preaching to the choir here). I don’t think I’m being overly optimistic if I were to say that the likelyhood is that if this were the case, it would’ve been reported/fixed already.

I looked and found this one but it seems related to many GameObjects only. I also found this active one.

1 Like

I’m aware this is not you area of expertise but I do appreciate someone from Unity replying at all! So thanks for that! :slight_smile:

Right, well it’s obviously hard to reason around what could cause it but it sure seems related to the new UI stuff.

The second bug you linked seems spot on.

A few points to make clear:

  1. All of us in the team have this issue and we are using a wide set of different computers so It’s very likely not related to any hardware.

  2. Given the info in the bug you linked this can be reproduced in most versions from 2019.4 (perhaps even .3) and above. Those explicitly not stated in the bug are probably just not tested.

  3. It can be reproduced with a simple sample scene.

Given that these are the case, most ppl using 2019.4 or later should experience this, and in my opinion this is quite a big issue. Not being able to inspect the values of a game object while playing (and remaining sane) seems like a pretty basic feature one should expect from the editor.

So how come this issue is not actively being addressed by the developers?

Not being on those teams I have no idea, sorry. I could guess at reasons but it’s just a guess.

Not everyone experiences it like this though so whilst I do acknowledge your justified frustration here, it’s not necessarily the common experience. Of course this depends on what the reason is that you’re seeing an issue.

If you have a super easy way to reproduce this that is experienced by multiple members of your team, especially if it’s on different devices/platforms then you should go ahead and submit a bug report (assuming you’ve not already) because often it’s the assumption that it’s already been reported and that the reason you have an issue is the same as someone else based on the fact that a thread title is the same or a reported bug has a similar description.

TBH I find myself here with no real way to help you sort this out apart from respond. A bug report is yours, it’s your experience and your way of tracking the issue.

Right, well if you look at the bug it states that given a scene with only a simple cube the framerate is vastly different in play mode when that object gets selected (and visible in the inspector). It mentions an attached file which I can’t find but I’ll set up the same scene later today my self to se if I get the same result.

If this is indeed the case and then most likely not unique for cubes I don’t really see how anyone can create a scene in which this is not the case.

I’ll investigate and get back to you.

I don’t disagree but you also asked about why a bug report might be not addressed. One of things is priorities. Bug reports, even ones that are potential duplicates can offer more insight into the problem but also automatically bump-up the priority, something we call “user pain”. It’s a bug report metric used as part of the priority system.

EDIT: I will add that I can do what you describe above and I don’t have an issue on a few machines here so it’s not always as trivial as you suggest.