There is no built in support for play maker.
Can Make Stacked Bar Chart in Descending Order? If it is Possible please Explain How to Do?
Thanks in Advance.
just answered you by email.
Hi @BitsplashIO_1 , with 3D graphs is there any way that I can remove points?
In lieu of a 3D streaming graph at present, I was hoping to fudge a scrollable graph in the x-axis somehow.
The online Manual seems to be majorly out of date and buggy.
Why is the Category name changing on each step?
SetCurveInitialPoint doesn’t take a vector2 as its 2nd argument. it takes 3 agruments, cat name, x and y
AddLinearCurveToCategory takes DoubleVector2 as argument 2 and not Vector2
Graph Chart Curves: 1. First off , you must set up a category as a curve category , this can be done via the inspector or via code : graph.DataSource.ClearAndMakeBezierCurve(“Cat 1”); // for curved line graph.DataSource.ClearAndMakeLinear(“Cat 1”); // for normal lines
-
Set up the initial point for the curve: graph.DataSource.SetCurveInitialPoint("Cat ", new Vector2(1ff, 1f));
-
Then add segments to the curve using any of the following methods: graph.DataSource.AddLinearCurveToCategory(“Player 2”, new Vector2(i * 10f/30f, Random.value * 10f + 10f)); // add a line segment to a curve category graph.DataSource.AddCurveToCategory(“Player 2”, controlPointA,controlPointB,DestinationPoint); // adds a bezier curve segment to a curve category
-
You can also call graph.DataSource.MakeCurveCategorySmooth(“Player 2”); This will override all currenly set control points , and will make a smooth transition between all the segment points.
How do you do you make the Horizontal axis count from 60 to 0 left to right. Instead of 0 to 60. Is it possible to make it descend?
I keep getting hit with
Invalid category name. Make sure the category is present in the graph
I have a category named Networth that I created in the editor.
        Graph.DataSource.HorizontalViewOrigin = 0;
        Graph.DataSource.HorizontalViewSize = 60;
        Graph.DataSource.VerticalViewOrigin = low;
        Graph.DataSource.VerticalViewSize = high;
        int Days = 0;
        foreach(JSONNode p in points){
            Graph.DataSource.AddPointToCategory("Networth", Days, points.AsFloat);
            Days++;
        }
The part that you mentioned indeed was a little out of date , It changed when DateTime overloads were added there. Thank you for bringing this to my attention , I have changed it and will reupload the docs soon. I have also change the category name to “Player 1” so it’s the same as the rest of the document.
However please note that this far from being “Majorly” out of date or buggy. The docs illustrate all essential parts of Graph and Chart in a dependable manner. Also if any issue arises I can be contacted via email, or forum.
regarding your question , This was not supported initialy and will be supported in the next major version. However there is a quick fix for this issue, I will send it you by email.
If you are seeing An invalid category warning it probebly means that the name you have written does not much the once in the inspector. Make sure that there are no spaces and know that the names are case sensitive
It matches the name in the inspector. Here is the code and a picture of my inspector. Even showing the edit name window with it.
Graph.DataSource.AddPointToCategory("Networth", 1, 2);
Invalid category name. Make sure the category is present in the graph

I have replied to you with an email of possiblites, this is most likely relating to clearing the categories or removing them after init. Please contact me via email regading this.
Hi @BitsplashIO_1 - you may have missed my question above. Also, when is the 3d streaming graph feature going to be released?
Hopefully in the next version. There is a big update which i am working on which will include many changes , including this one. The idea is that you fill the Graph with the data , so if you want to remove points , just refill it with the new data.
Also if you have additional questions , it is best to contact me via email support@prosourcelabs.com. Sorry for missing the previous question.
1 Like
Thanks for the update- looking forward to the new release.
Hello, is it possible to disable the input detection on the graph lines and points?
Yes. Set the hover prefabs to null :
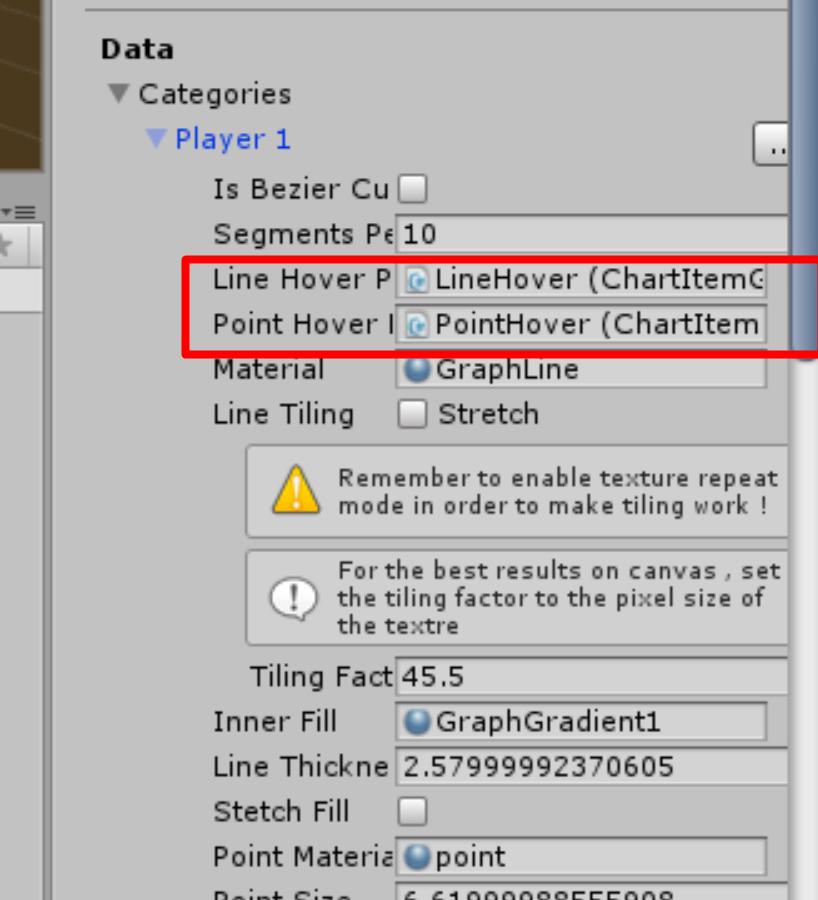
Hi Guys at ProSourceLabs,
Just have a question before buying this fantastic asset,
Is all source code attached or is something under a dll or sorts.?
Thanks
All source is included.
Is Unity Version 5.6.3 and next Version supported to?
What has changed between last Video and actual Version?
When next Version will arrive?
Thanks for Information
You can look for my post in this forums describing what is coming in this version and the next ones. The next version supports any unity version above 5.6.1 . As for now the next version is on progress but it might take some time until it’s out. Biggest change will be massive performance improvement that can already be seen in the development version.
Is there any possibility to set min and max and disable X Labels?
Yes. you can do that via the datasource settings and the axis settings.
Under Data found Horizontal View and Vertical view witch define View Origin(min Value) and Size(Offset from min)
to disable X Labels I selected under Horizonta Axis->Main Devision->Messure = Data Units instead of Total devision witch disabled the horizontal labels