So for every GO I ever had in my scene, considering I have not got the texture allocated in a Texture variable, and unless I load a new scene, I have to go
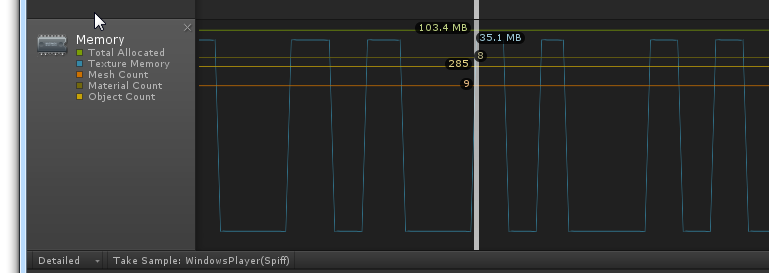
I was just experimenting with this very thing, and I was very surprised to see that enabling/disabling a GameObject does seem to free/allocate texture memory. At least, according to the Unity Profiler:
The above profile is what I see when I load a scene, and the enable/disable the scene root GameObject in a loop, using coroutines to pause in between.
	IEnumerator TestSceneLoading( string name )
	{
		AsyncOperation async = Application.LoadLevelAdditiveAsync( name );
		yield return async;
		//Debug.Log( "Scene loaded " + name );
		float t = 0.1f;
		int i = 0;
		while ( i < 10 )
		{
			i++;
			GameObject go = GameObject.Find (name);
			yield return new WaitForSeconds (t);
			go = go.transform.FindChild ("root").gameObject;
			//Debug.Log ("Setting active " + go.name);
			yield return new WaitForSeconds (t);
			go.SetActive (true);
			//Debug.Log ("Setting inactive " + go.name);
			yield return new WaitForSeconds (t);
			go.SetActive (false);
		}
		GameObject scene = GameObject.Find (name);

		Destroy( scene );
	}
and this is what my scene1.unity looks like:
the ‘data’ node contains the a quad with the large texture.
I’m using LoadLevelAdditiveAsync, so the initial load is Async, but I don’t see any framerate spikes (though it is on a fast PC), when the memory is alloced and freed, leading me to question the memory graph.
Is the Profiler lying?
Thanks!
Travis
edit: OK, so the Texture Memory (blue line) graph, is not accurate, or, I was misinterpreting it. You can see from the green line that total memory usage is not changing, and when I looked at the “Simple” summary view (bottom window), it confirmed that even the Texture Memory usage was constant at 35 MB.