When profiling in the Unity Editor in play mode, “GC Allocated” is very useful because it immediately shows the frames where memory is allocated. But when profiling standalones and also when using
This shows “0B” for every single frame, even though the list view (Hierarchy / Overview / GC Alloc) shows significant allocations (e.g. one frame with 241.3 KB).
Is this a known issue? A bug? Am I doing something wrong?
You’re doing everything right.
This is unknown issue and it might be a bug with cumulative stats calculations.
Please report it if you have a stable repro.
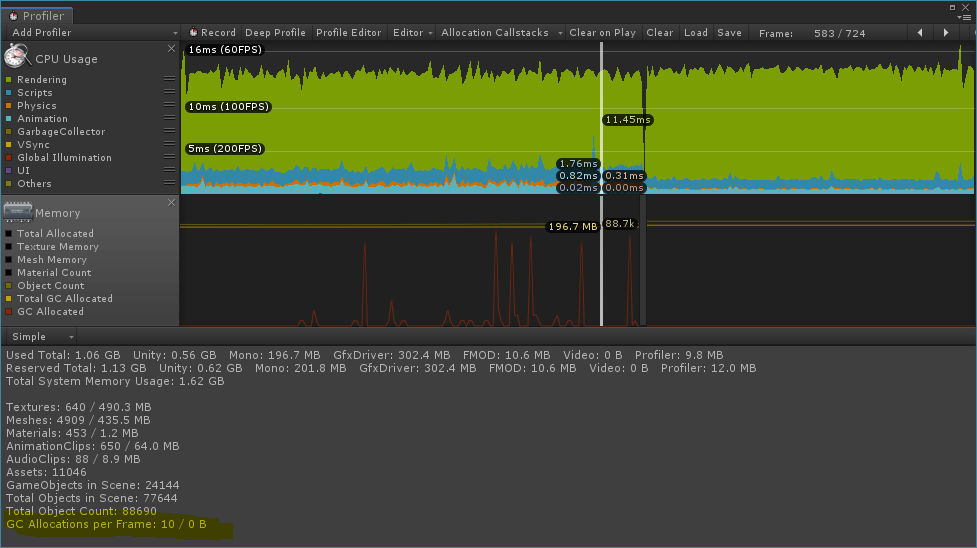
It is now a few years later, but I just noticed the same thing. I am profiling a Windows standalone with Unity 2018.4.9f1, and I am seeing this (edited):
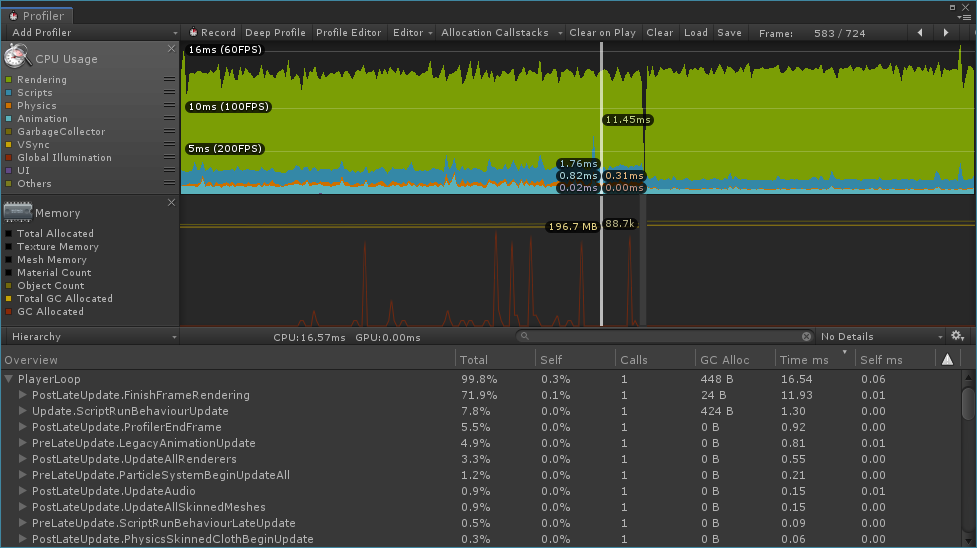
So the allocations are visible in the Timeline view, but not in the Memory module graph. The amount of allocations is (I assume) correct in the Simple view, but zero bytes must be wrong. The hierarchy view is actually showing 448 bytes of allocated memory for the frame, so I assume that there were actually 10 allocations adding up to 448 bytes of allocated memory this frame. Note that memory allocations are shown in the Memory module graph and Simple view.
Since the Hierarchy view only shows allocations in the PlayerLoop, and the Memory module shows allocated memory from all the threads, the latter should always show a higher number, right?
Is this broken? I certainly makes the Memory module graph (and Simple view) harder to use.
Thanks for highlighting it! It is wrong, but is by design
The reported size is recorded in KB, that basically slices the values less than 1024 bytes. Unfortunately, we can’t fix old data as it has incomplete information, but we are reworking the stats system at the moment and making sure we capture all bits and pieces in full.
I would say that that isn’t a brilliant design then. It means that when I am allocating 0.9 KB per frame, I get a ‘zero’ line in the graph, indicating that I am not allocating anything. The only thing that gives me an indication in that same profiler module is a tiny number here: ‘GC Allocations per Frame: 3 / 0 B’ Which is only visible when you have that module selected. When I am looking at the Timeline, there is only the graph. And the graph says ‘zero’. There is also no difference between allocating 12 bytes per frame, or 1023 bytes. The first is probably fine, the second might be a problem.
My issue is however with the presentation. When a number is displayed, it is for example 3.0 KB. This seems to indicate that fractions of KBs are possible (for example 0.7 KB). That indication is false, however: the number always has one fractional digit, and when displaying KBs, this is always zero (by design, since you store in kilobytes). Only bigger values will have a non-zero digit (15.3 MB). When less than one KB is allocated per frame, the profiler displays ‘GC Allocations per Frame: 1 / 0 B’, implying that you can display on a ‘byte’ level. If you had displayed something like ‘GC Allocations per Frame: 12 / < 1 KB’, then the number would not be ‘lying’, and there would be no confusion (maybe it’s just me).
I am not sure what you mean by ‘Unfortunately, we can’t fix old data as it has incomplete information’.
Anyway, back to profiling my game. Apologies for the rant