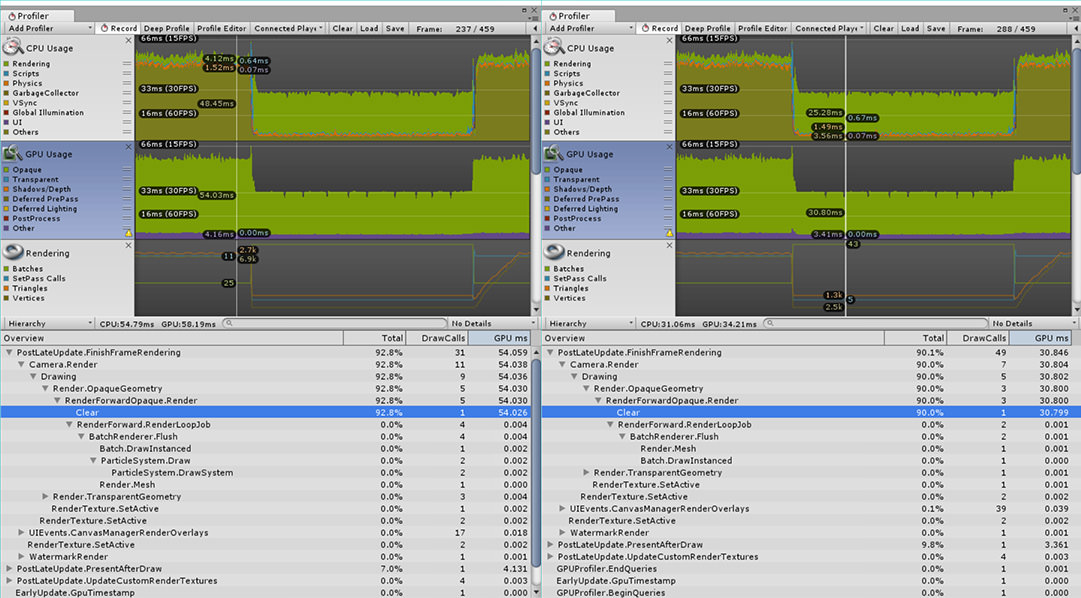
I’m trying to optimize my app in unity for android and I’m getting a strange result for my rendering in the profiler. In the game, I have a game camera and a “Ship Select” camera. the only difference is I switch cameras and turn off the main canvas and turn on the ship select canvas. When I’m on ship select, the rendering is fine, when I’m back in the game view, the rendering goes way up. I can’t narrow it down as I’ve tried turning on and off everything that’s different between the two modes. Any help would be really appreciated.
I’m attaching an image of the two states side by side. Please let me know if you have any advice.

Thanks,
Dan