Hi Guys
I very regularly get this, just from clicking in project settings, without changing any settings.
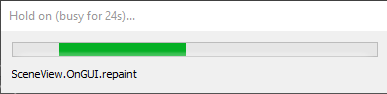
What is this and why am I getting it? Hard to be productive when this pops up every few clicks
Hi Guys
I very regularly get this, just from clicking in project settings, without changing any settings.
What is this and why am I getting it? Hard to be productive when this pops up every few clicks
For example I highlighted a HDRP Quality asset in Assets > Settings, hit CTRL+D to duplicate it. That should be instant, but this came up and was sitting there for about 30 seconds:

64GB Ram
12 core i7
RTX 2070 Super
Windows 10 Pro 20H2
NVidia Studio driver 461.40
SSD drive for OS and this project
Simply selecting the Main Camera in the HDRP Template scene:

Anybody?
I have been getting the same. I am using 2020.2 though.There was a change in how Unity does messages to let you know what it is doing other than just saying hold on, my guess is that it is related to that change.
This causes some problems that I have run into to. If I am writing software in visual studio 2019, save and then switch back to unity. Sometimes the unity editor will compile the code other times I will have to minimize/ maximize unity to get the unity editor to recognize code changes have taken place. (I have set the correct setting in visual studio and unity for auto refresh but does not seem to change anything)
I mention this because they may be related. Its as if the unity editor is going into some sort of aggressive sleep mode, which could explain the repaint message you are getting.
I have not submitted a bug report yet since I am not sure if I am missing some setting in Unity or the OS
You should try to turn on the profiler in editor mode, so you get some clue about what’s causing the slowdown. It’s probably a Unity bug, but unless it’s happening with everyone, a bug saying “sometimes something is causing a slowdown” isn’t very easy to investigate.
When you shutdown the editor and you look at the Editor.log you should see many [Performance] … entries. Please share those log entries. It can maybe show what is stalling that much and how much time each performance tracker took.
Here’s an example of those performance trackers that gets logged when you shutdown the editor:
[Performance] GameView.MouseLeaveWindow : 2 samples, Peak.   115 us (1.2x), Avg.  97.7 us, Total. 195.4 us (0.0%)
[Performance] TooltipView.Paint         : 2 samples, Peak.  51.0 ms (2.0x), Avg.  25.7 ms, Total. 51.38 ms (0.0%)
[Performance] TooltipView.Repaint       : 2 samples, Peak.  49.6 ms (2.0x), Avg.  24.9 ms, Total. 49.85 ms (0.0%)
[Performance] SceneView.OnGUI.mouseDrag : 1 samples, Peak.  1.40 ms (1.0x), Avg.  1.40 ms, Total. 1.404 ms (0.0%)
[Performance] SceneView.MouseUp         : 1 samples, Peak.  1.20 ms (1.0x), Avg.  1.20 ms, Total. 1.197 ms (0.0%)
[Performance] SceneView.OnGUI.mouseUp   : 1 samples, Peak.   647 us (1.0x), Avg.   647 us, Total. 646.7 us (0.0%)
Sorry for the late reply took me a min to find that file
[Performance] GameView.Paint                                                             :   130716 samples, Peak.   125 ms (45.7x), Avg.  2.73 ms, Total. 356.8 s (2.8%)
[Performance] GameView.Repaint                                                           :   130716 samples, Peak.   125 ms (46.0x), Avg.  2.71 ms, Total. 354.0 s (2.8%)
[Performance] GameView.OnGUI.Layout                                                      :   130726 samples, Peak.  28.0 ms (113.4x), Avg.   247 us, Total. 32.27 s (0.3%)
[Performance] GameView.OnGUI.repaint                                                     :   130716 samples, Peak.   103 ms (52.5x), Avg.  1.96 ms, Total. 255.7 s (2.0%)
[Performance] SceneView.Paint                                                            :   119698 samples, Peak.  2.44 s (611.4x), Avg.  3.99 ms, Total. 477.1 s (3.8%)
[Performance] SceneView.Repaint                                                          :   119698 samples, Peak.  2.44 s (650.6x), Avg.  3.75 ms, Total. 448.3 s (3.6%)
[Performance] SceneView.OnGUI.Layout                                                     :   119776 samples, Peak.   102 ms (268.2x), Avg.   379 us, Total. 45.36 s (0.4%)
[Performance] SceneView.OnGUI.repaint                                                    :   119697 samples, Peak.   129 ms (45.7x), Avg.  2.82 ms, Total. 338.1 s (2.7%)
[Performance] GizmoManager.DrawGizmos                                                    :   239394 samples, Peak.  4.83 ms (93.2x), Avg.  51.8 us, Total. 12.40 s (0.1%)
Performance] GizmoManager.RecalculateGizmos                                             :      219 samples, Peak.   343 us (7.9x), Avg.  43.6 us, Total. 9.559 ms (0.0%)
[Performance] Toolbar.Paint                                                              :     1175 samples, Peak.  32.9 ms (14.4x), Avg.  2.29 ms, Total. 2.688 s (0.0%)
[Performance] Toolbar.Repaint                                                            :     1175 samples, Peak.  32.9 ms (17.6x), Avg.  1.87 ms, Total. 2.192 s (0.0%)
[Performance] ProjectBrowser.Paint                                                       :     1434 samples, Peak.  1.04 s (104.3x), Avg.  9.94 ms, Total. 14.26 s (0.1%)
[Performance] ProjectBrowser.Repaint                                                     :     1434 samples, Peak.  1.04 s (108.0x), Avg.  9.61 ms, Total. 13.78 s (0.1%)
[Performance] ProjectBrowser.OnGUI.Layout                                                :     1837 samples, Peak.   153 ms (56.1x), Avg.  2.73 ms, Total. 5.014 s (0.0%)
[Performance] ProjectBrowser.OnGUI.repaint                                               :     1432 samples, Peak.  28.5 ms (6.3x), Avg.  4.54 ms, Total. 6.506 s (0.1%)
[Performance] SceneHierarchyWindow.Paint                                                 :     2714 samples, Peak.  3.41 s (493.0x), Avg.  6.93 ms, Total. 18.80 s (0.1%)
[Performance] SceneHierarchyWindow.Repaint                                               :     2714 samples, Peak.  3.41 s (502.9x), Avg.  6.79 ms, Total. 18.43 s (0.1%)
[Performance] ConsoleWindow.OnGUI.repaint                                                :      425 samples, Peak.  3.04 ms (3.7x), Avg.   811 us, Total. 344.7 ms (0.0%)
[Performance] InspectorWindow.Paint                                                      :     3023 samples, Peak.  1.16 s (90.3x), Avg.  12.9 ms, Total. 38.89 s (0.3%)
[Performance] InspectorWindow.Repaint                                                    :     3023 samples, Peak.  1.16 s (91.6x), Avg.  12.7 ms, Total. 38.34 s (0.3%)
[Performance] InspectorWindow.OnGUI.Layout                                               :     3120 samples, Peak.  22.0 ms (264.7x), Avg.  83.1 us, Total. 259.4 ms (0.0%)
[Performance] InspectorWindow.OnGUI.repaint                                              :     3020 samples, Peak.  9.30 us (11.5x), Avg.   812 ns, Total. 2.452 ms (0.0%)
[Performance] Application.InvokeFinishedLoadingProject                                   :        1 samples, Peak.  46.5 ms (1.0x), Avg.  46.5 ms, Total. 46.53 ms (0.0%)
[Performance] ProcessService.OnProjectLoaded                                             :        1 samples, Peak.  40.9 ms (1.0x), Avg.  40.9 ms, Total. 40.86 ms (0.0%)
[Performance] Application.InvokeProjectWasLoaded                                         :        1 samples, Peak.  1.00 ms (1.0x), Avg.  1.00 ms, Total. 1.002 ms (0.0%)
[Performance] Application.Message                                                        :  3252164 samples, Peak.  8.31 s (176190.0x), Avg.  47.1 us, Total. 153.3 s (1.2%)
[Performance] Application.Message.WM_00060                                               :      930 samples, Peak.   570 us (9.9x), Avg.  57.8 us, Total. 53.78 ms (0.0%)
[Performance] Application.Message.MouseMove                                              :    47659 samples, Peak.  1.53 s (2088.1x), Avg.   733 us, Total. 34.92 s (0.3%)
[Performance] ProjectBrowser.Ignore                                                      :     1284 samples, Peak.  1.70 us (2.0x), Avg.   859 ns, Total. 1.104 ms (0.0%)
[Performance] Application.Tick                                                           :  3253495 samples, Peak.  4.86 s (7679.3x), Avg.   633 us, Total. 2.059 ks (16.4%)
[Performance] Application.TickSceneTracker                                               :  3253495 samples, Peak.   728 ms (5246.2x), Avg.   139 us, Total. 451.4 s (3.6%)
[Performance] EditorApplication.update                                                   :  3253495 samples, Peak.   724 ms (5899.1x), Avg.   123 us, Total. 399.4 s (3.2%)
[Performance] ConsoleLog.Tick                                                            :    61409 samples, Peak.   404 us (126.8x), Avg.  3.19 us, Total. 195.7 ms (0.0%)
[Performance] HierarchyWindow.Tick                                                       :    17222 samples, Peak.  10.7 ms (2868.4x), Avg.  3.72 us, Total. 64.10 ms (0.0%)
[Performance] Inspector.Tick                                                             :    17222 samples, Peak.  34.8 ms (246.1x), Avg.   141 us, Total. 2.436 s (0.0%)
[Performance] Tooltip.Tick                                                               :   238147 samples, Peak.  37.2 ms (1027.4x), Avg.  36.2 us, Total. 8.624 s (0.1%)
[Performance] Application.RequestRepaintForPanels                                        :   589194 samples, Peak.   742 us (132.0x), Avg.  5.62 us, Total. 3.312 s (0.0%)
[Performance] Application.UpdateScene                                                    :   589194 samples, Peak.   608 ms (385.2x), Avg.  1.58 ms, Total. 929.7 s (7.4%)
[Performance] GUIView.RepaintAll.PlayerLoopController                                    :   130609 samples, Peak.   607 ms (93.7x), Avg.  6.48 ms, Total. 846.3 s (6.7%)
[Performance] Application.UpdateTextureStreaming                                         :   324513 samples, Peak.  16.1 us (42.7x), Avg.   377 ns, Total. 122.5 ms (0.0%)
[Performance] Application.UpdateVideoTextures                                            :   324513 samples, Peak.  85.8 us (330.2x), Avg.   260 ns, Total. 84.33 ms (0.0%)
[Performance] PackageImporter.Tick                                                       :    61393 samples, Peak.   125 us (177.3x), Avg.   703 ns, Total. 43.14 ms (0.0%)
[Performance] InspectorBackground.Tick                                                   :    81591 samples, Peak.  15.3 us (17.7x), Avg.   866 ns, Total. 70.62 ms (0.0%)
[Performance] Application.ChangeLayoutIfNeeded                                           :  3253495 samples, Peak.  3.28 ms (13362.1x), Avg.   246 ns, Total. 799.2 ms (0.0%)
[Performance] AsyncReadManager.ForceCloseFiles                                           :    12413 samples, Peak.   278 us (103.1x), Avg.  2.70 us, Total. 33.47 ms (0.0%)
[Performance] GUIView.RepaintAll.RepaintScene                                            :   458605 samples, Peak.  4.86 s (7543.2x), Avg.   644 us, Total. 295.3 s (2.3%)
[Performance] Application.Message.Timer                                                  :      891 samples, Peak.  93.9 us (7.6x), Avg.  12.4 us, Total. 11.06 ms (0.0%)
[Performance] Application.Idle                                                           :  2943915 samples, Peak.  34.8 ms (10.0x), Avg.  3.47 ms, Total. 10.20 ks (81.1%)
[Performance] Application.Message.WM_00203                                               :       22 samples, Peak.  8.31 s (15.1x), Avg.   550 ms, Total. 12.10 s (0.1%)
[Performance] InactiveGI.Tick                                                            :    38851 samples, Peak.  1.12 ms (20.9x), Avg.  53.6 us, Total. 2.082 s (0.0%)
[Performance] RequestRepaintForPanels                                                    :  2664301 samples, Peak.  1.07 ms (257.2x), Avg.  4.16 us, Total. 11.10 s (0.1%)
[Performance] GUIView.RepaintAll.RequestRepaint                                          :  2664301 samples, Peak.   551 ms (14335.4x), Avg.  38.5 us, Total. 102.5 s (0.8%)
Thanks @Bosozuki , unfortunately it’s not clear from the shared parts what is going on. Could you please submit a bug report for this issue and reference the issue ID in this thread? The bug reporter automatically attaches the log file and other relevant data that can help us identify the issue.
Thanks I submitted the bug report, just waiting on the issue ID now.
Its a quirky issue more of an annoyance than anything. My guess is that I am floating around some edge case from using four monitors, I have four monitor layout setup for Unity and I switch between Visual studio 2019 and unity through the task bar. I put all of that info in the bug report along with a screenshot.
This has been quite frustrating for me too, it really slows down the iteration speed and makes the overall UX frustrating
After every single time I open Unity it takes 5-7 mins just to open and to import something during that although nothing’s changed, it even has to do script compilation at each startup for some reason 
Also when clicking anything in the hierarchy it takes quite a long time to respond
I had been wondering if my system had slowed down but then I checked it with older versions of unity and it was fine
Yeah there is absolutely something to investigate. What would help the most is if you can submit a bug report and share your project that repro these slow down issues or if you can pinpoint where the slow downs are using the Profiler and saving the traces (.profile files).
Can you tell me how I can share this, I have no idea where the log files are either
Also, I don’t think I can submit a particular project because it is tied to unity versions and not the project itself
Case ID 1313824
I will create a better project if I am able to better reproduce the issue. Its almost as if the Unity editor when losses focus (click on another application or minimize) and I try to click back onto Unity it does not want to refocus or does focus but into to some weird state, hence the unity editor does not see the script code changes or when you click on the assets in the hierarchy the gui.repaint message appears.
I feel like I am not being very helpful here… but I will try a few more experiments to see if I can more reliably reproduce the issue with steps
I had a similar issue in our project that I couldn’t reproduce in a separate clean project. The Unity would start showing a busy message if I open a popup list in animation panel or context menu in Project window.
Are any of u using HDRP with Vulkan api? This combination causes similar symptoms to what u describe (with the exception that 90% of the time the editor never unlocks again I have to manually kill it).
It’s probably unrelated but just in case.
Does anyone actually use 2020.x ? “Hold on busy (for …s)” seems to be a non-stop occurrence. I’ve actually got work to do. Sticking to LTS.
This is really frustrating. Can we please have any update on this?
Getting this also. Often waiting on a progress bar after clicking an inspector or moving a prefab/gameobject