I have a cross-platform project that is collecting a bunch of different data. Currently I display that data in text table format in Unity, but I’d like to get some nice visualizations as charts/graphs. Basically, I’d like some kind of system where I could give it the type of chart/graph I want, the data I want displayed, and it gives me back an image which I can then display in Unity. I figure there are two possibilities: Some kind of C# library that can be integrated into my project, or some kind of web service that I can send data to.
Does anyone know of an easy/best way to do this?
I’ve seen others mention the Google Chart API, but after reading about it it sounds like it’s a Javascript solution intended to run in a browser. It doesn’t sound like it could work with Unity.
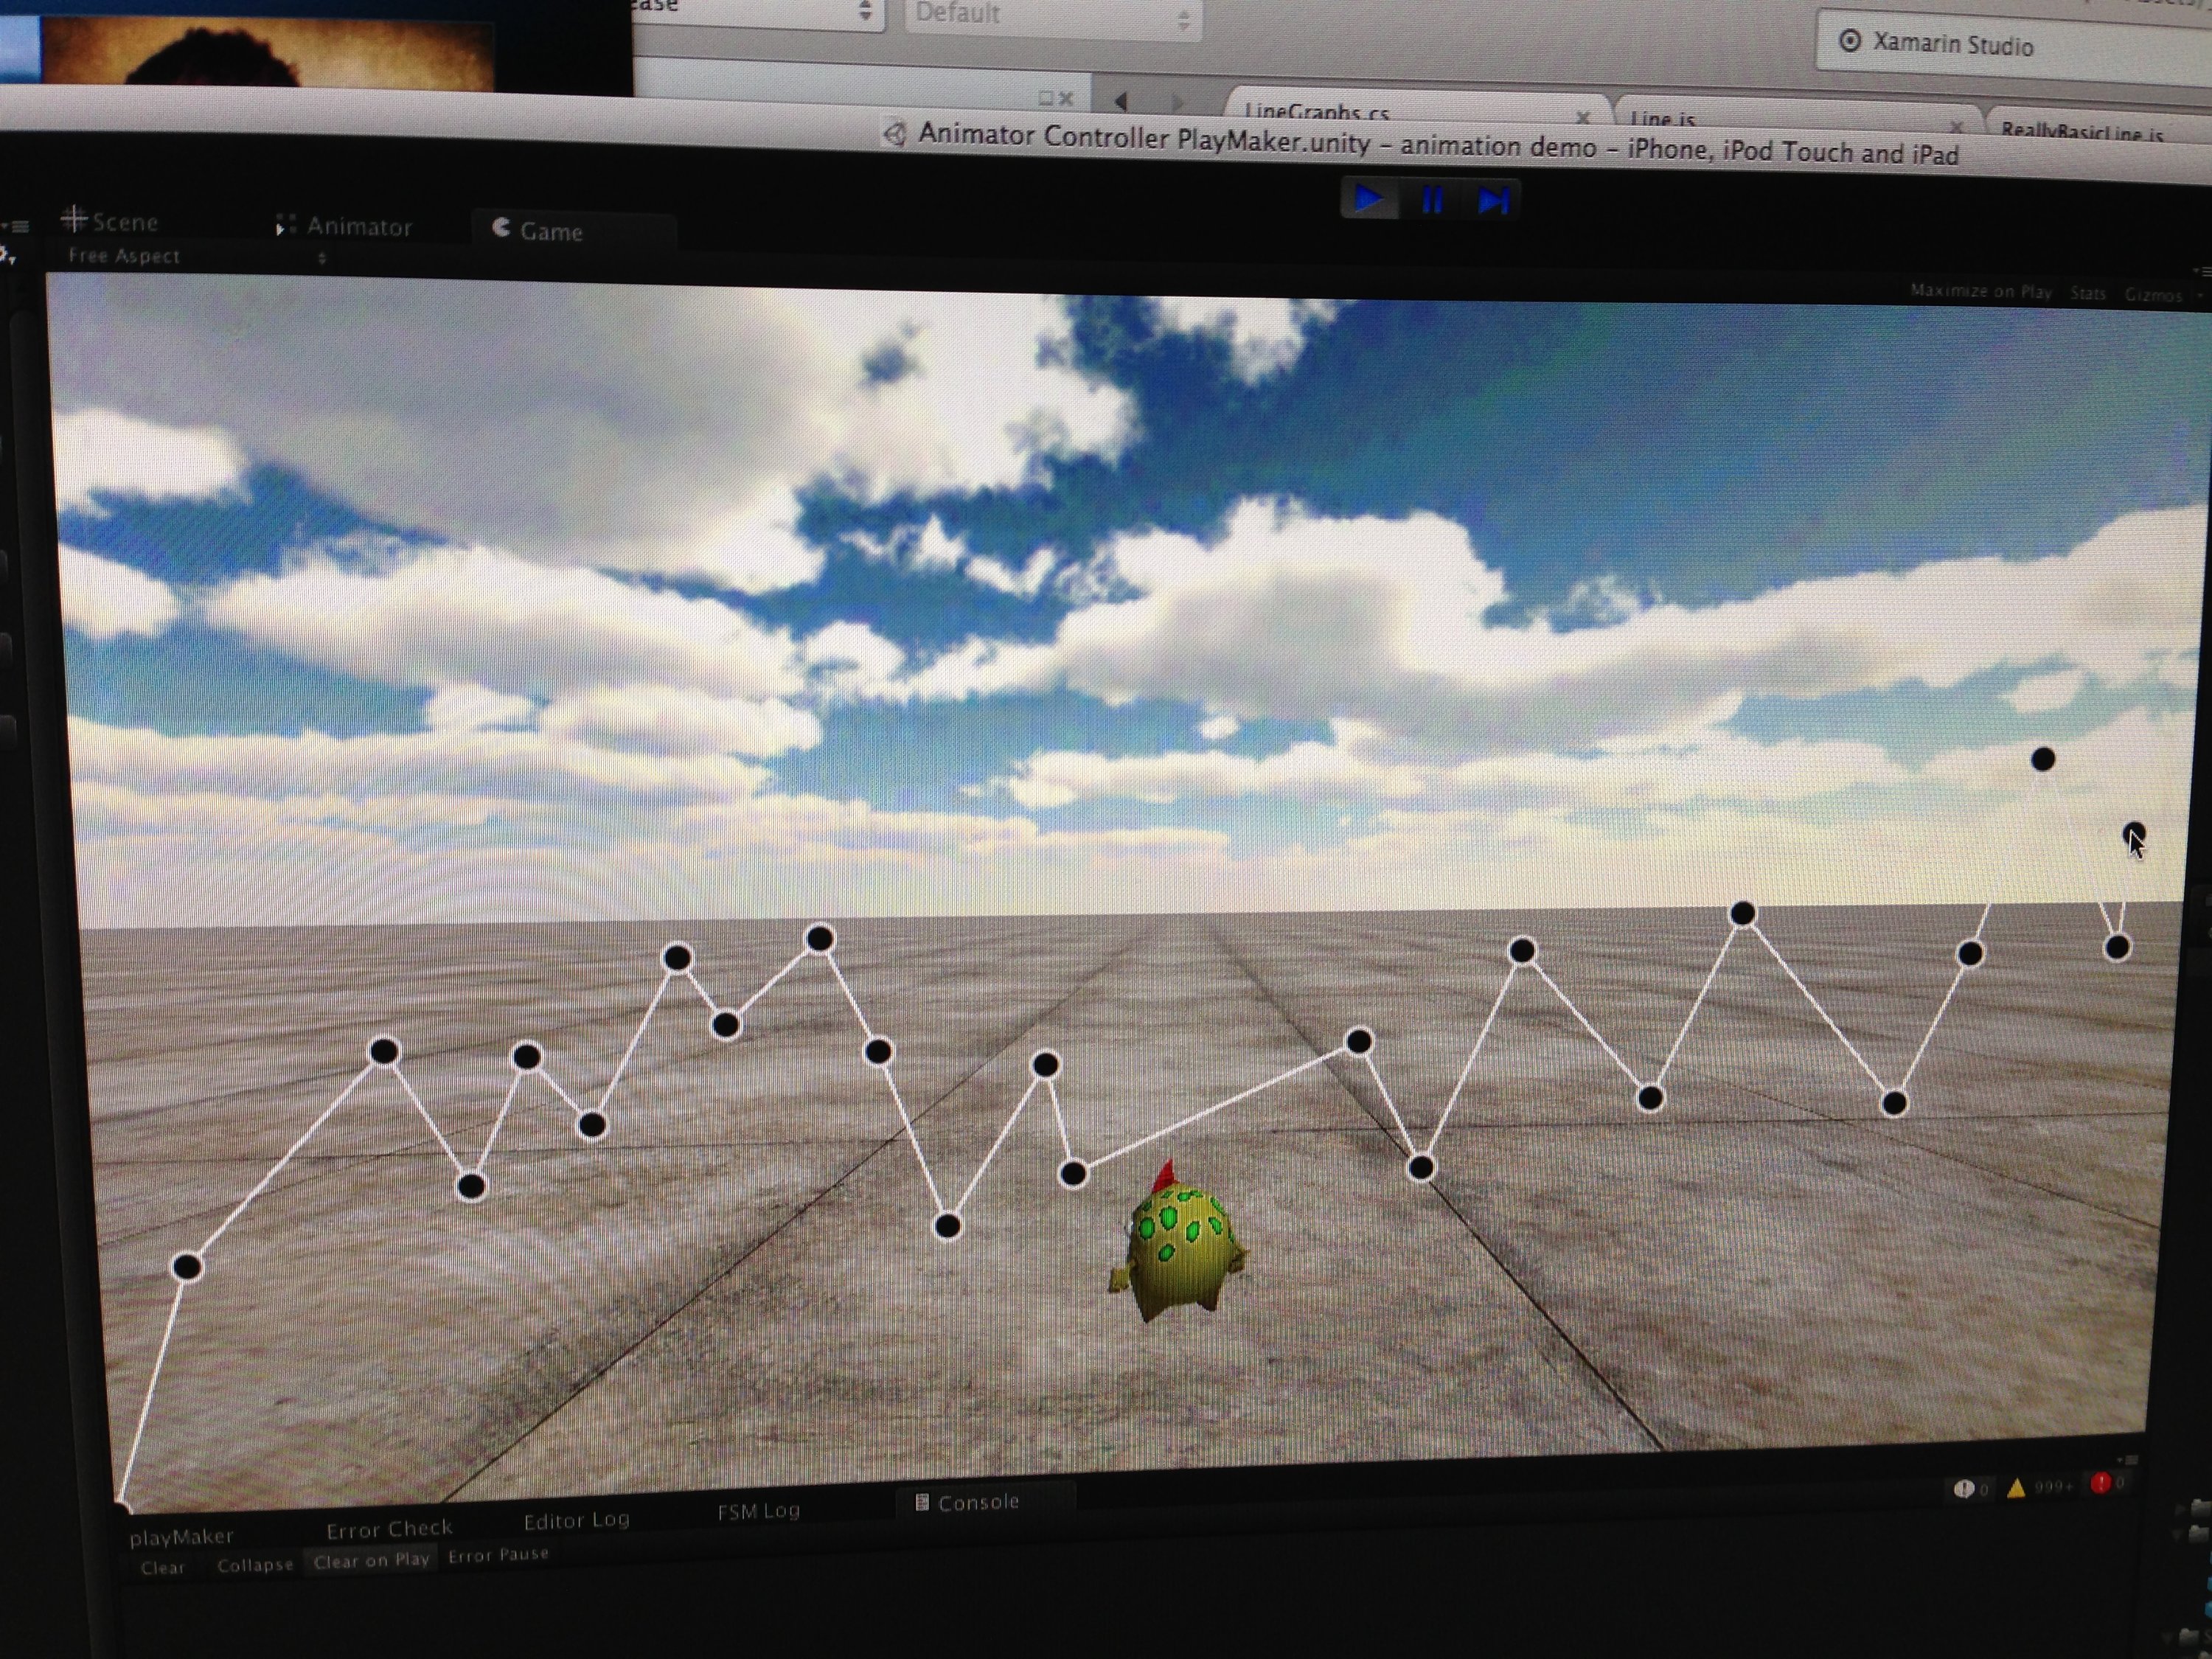
I’ve made a XML diagram that showed the data in a editor window a while ago, let me know it you wanna get the code (It’s kinda messy though) I simply took the data via XmlDocument and stored it in a array, iterated though all data and draw a line between last point and current point It was easier than I thought
Ah, thanks Eric. Sorry, had missed your reply earlier.
Yeah, Vectrosity could work, specifically for the line drawing bit… but I was hoping for some sort of more turnkey solution where you, for example, just provide a set of x/y data points and a desired graph type (e.g. - line) and the solution will figure out the scaling, min/max, axis labeling, etc. and create the fully labeled chart. I think that’s how Google’s Charts API works but I’ve never actually used it.