I’m currently preparing a new DOTS based project and checked why the edit->play switch already takes around 3 seconds.
The editor enforces a full synchronous GC.Collect on EnterPlayMode and on scene load
Why synchronous, letting the incremental GC do it’s work should be enough?
GarbageCollector.GCMode isn’t available in the editor
StartNoGCRegionWorker isn’t available in mono
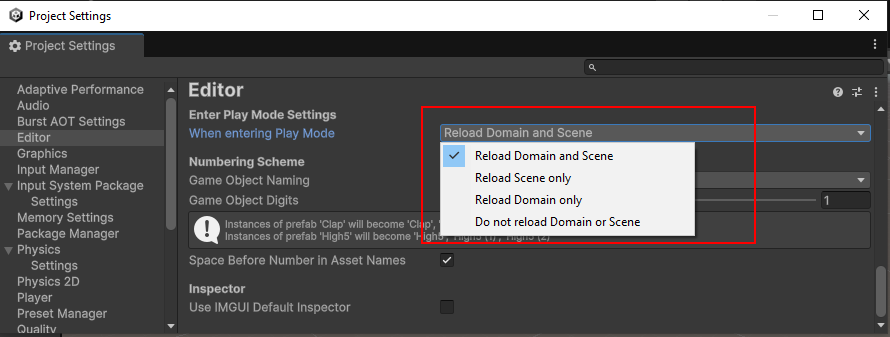
Do not reload Domain or Scene is set
Is there any way to prevent or work around this in the editor to improve on iteration time? If there is none a setting would be welcome. I can GC.Collect it myself if really required.
Superluminal sample. SingleSceneLoadPost and ActivateSceneAfterReset are each executed once.
What are the editor and package versions? If you aren’t using the latest, try upgrading (or downgrade to a stable release if you use a preview package).
Is the editor in debug or release mode?
Does this occur in an empty project with just the packages installed, or do you already have other assets in that project? In the latter case, try a repro in an empty project.
My hunch is that either there’s a regression or an editor script (tool or package) that generates lots of garbage. Check if the behaviour changes if you close all unnecessary windows. Reset layouts just in case - sometimes a lingering zero-sized window can also cause issues. I’ve had performance issues and log spam in the past simply due to certain windows being open, sometimes even related to what’s selected in the scene or project.
It’s been a while since I last used Entities but enter playmode always used to be instant. It’s also instant without Entities. Disabled domain reload is all that matters.
Unity 6000.0.22f1 with all packages up to date, no preview (Entities 1.3.2).
Debug mode editor, but debug shouldn’t execute a collect either.
Happens in mostly empty project too.
Default layout → same issue.
I don’t think this is due to the amounts of garbage produced and I don’t think this is related to packages. I preallocated the heap to not exceed it with the allocations done by load and this still happens.
This seems to be a manual GC.Collect with Forced mode executed by Unity.
1.2s might be considered instant by some but this collection is completely unnecessary.
Whether is’t a manually forced collection or not doesn’t really make that much of a difference. Eventually the GC will run and has the same amount of work to do. Keep in mind that when the GC runs, all other managed threads are suspended. The GC can not run while user code runs at the same time. The GC itself may utilize multiple threads to perform it’s collection and clean up tasks concurrently, but in any case your own code will stall. See this article and the various timing diagrams.
Before a garbage collection starts, all managed threads are suspended except for the thread that triggered the garbage collection.
Though it should be noted that the triggering thread would participating in the GC process and doesn’t continue normally.
It does make sense to manually trigger a GC Collect after a new scene has been loaded since all the memory of the unloaded scene is waiting for collection anyways. Note that generations within the GC just manage how often which buckets are collected. GC is generally a difficult topic and the exact beaviour can vary heavily depending on the used garbage collector and on how many memory and threads are available
In Unity’s incremental GC the marking process is running completely parallel to the user threads. The profiler shows that it takes 99% of the time marking and only <1% acually collecting.
In the case above the marking process is run synchronously which indicates either
a forced blocking gc collect demanded by the application
a forced blocking gc collect due to running out of memory
The second one is definitely not the case here.
A manual collect can lead to a smaller .net heap, so yes it can make sense after freeing a lot of managed memory to prevent heap expansions. But blocking here on development machines to reduce the heap spike by a few MB should at least be a setting I can opt out.
If I trigger a manual blocking collect it has exactly that stacktraces and takes exactly the same time.
There are no generations in Unity’s GC.
While Unity’s allocator does use different memory pools for small and large allocations, Unity’s garbage collector isn’t generational, so it can’t efficiently sweep out the small, frequent temporary allocations that boxing generates. (Unity - Manual: Garbage collection best practices)
It needs to be set to Do not reload Domain or Scene if you want entering play mode to be fast, regardless of if you’re working in dots or gameobject. Since you’re seeing these as side-effects of SingleSceneLoadPost, I suspect you might have reload scene on?
I tested some more. When pressuring the GC by producing garbage the collection that happens is only doing a part collection that takes around 4ms, far from the 500 ms of the full forced collection that is happening twice on play mode switch.