Task Manager’s energy cost is basically the same idea as CPU time but extended to the GPU too. It’s measuring the amount of time the app is actively using the CPU and GPU. You’ll see this number be high for applications that need to use both and generally low for applications that only use the CPU.
It’s helpful for laptop users who want to maximize their battery life but it’s largely meaningless for everyone else.
Unity uses the GPU to render the editor UI which in turn involves the CPU. The overall size of the project shouldn’t matter but custom editors can have a major impact depending on how frequently they need to redraw. Worst case would be a full redraw every frame but that shouldn’t happen in most cases with well written editors.
I can show you the results but be aware that unless you have similar hardware (AMD 5950X, 64GB RAM, RTX 3070) you’re not likely to see similar numbers. Most of my projects require me to either enter play mode or make a build to see more than single digit usage for CPU and GPU.
For example Unity spawns 55 processes due to my CPU having 16 cores/32 threads. Here’s a screenshot of when I enter play mode.
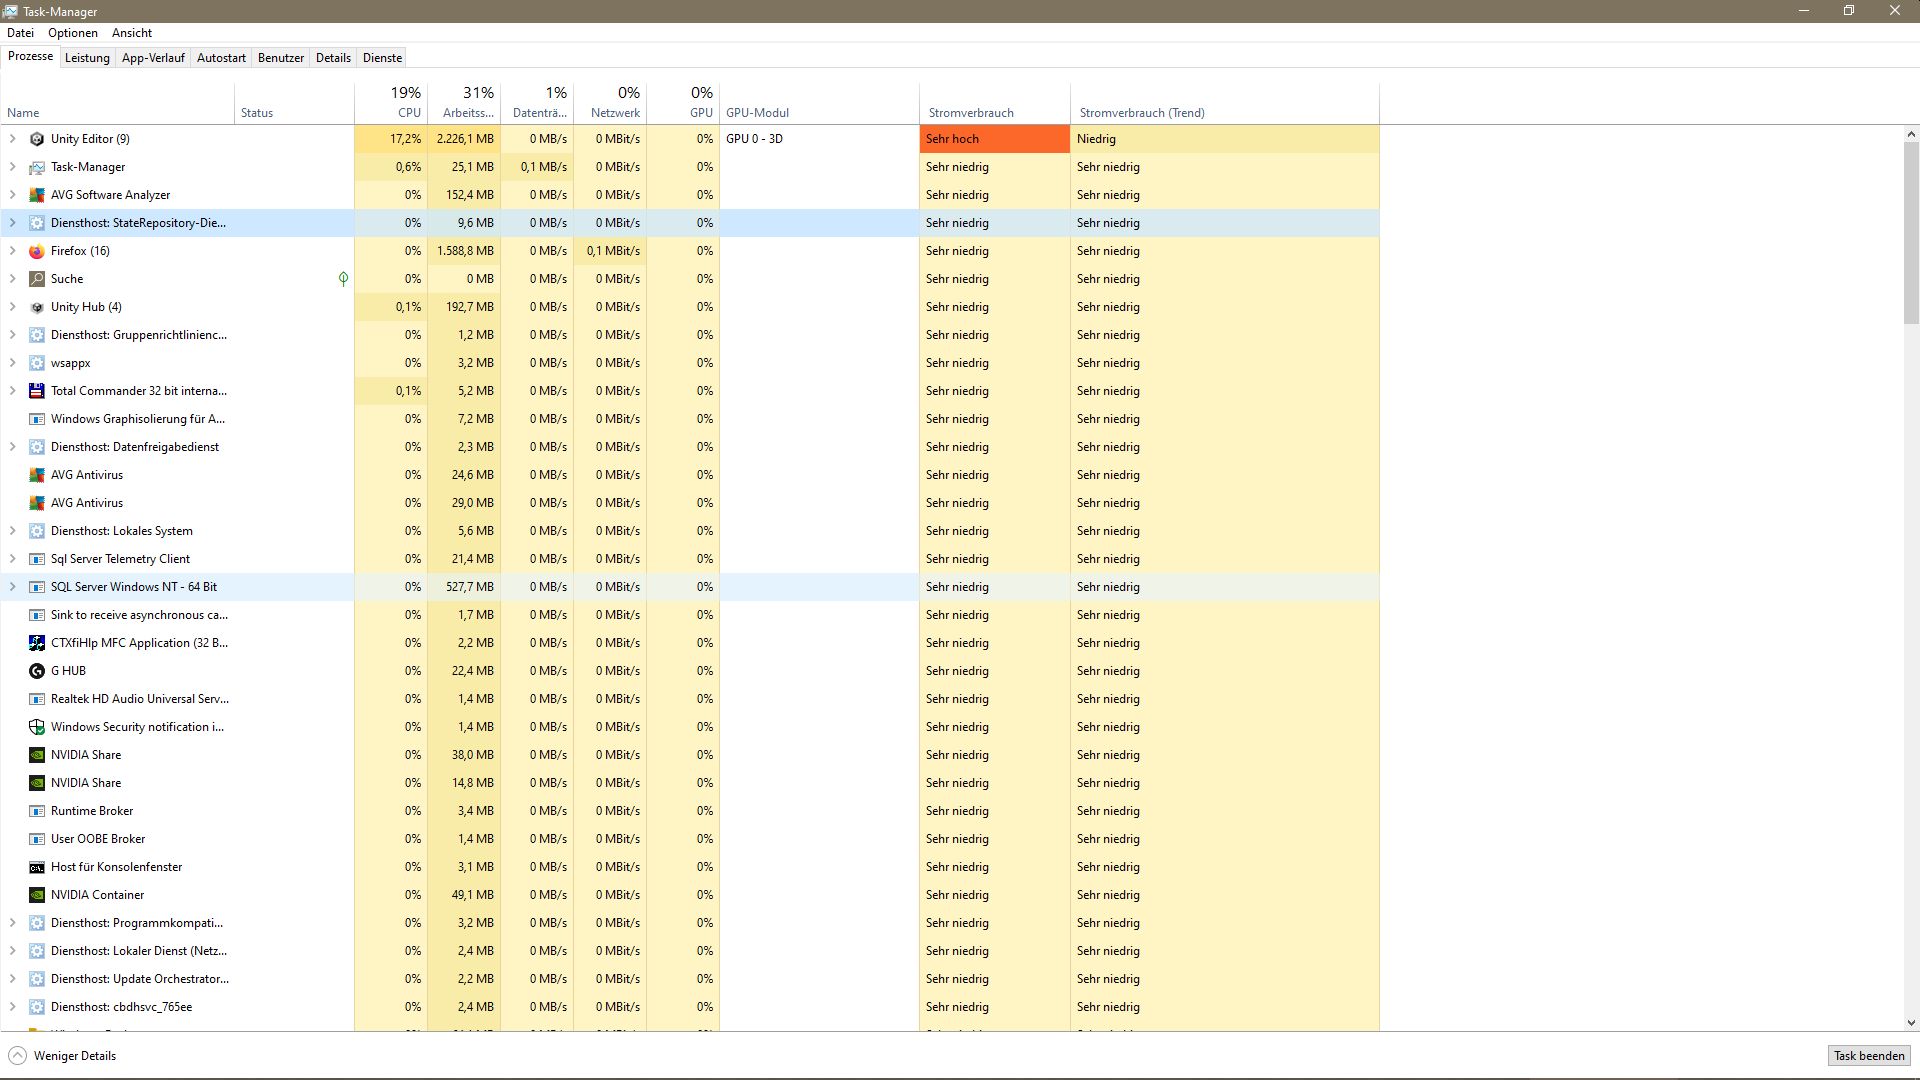
Even in a relatively large project unity does not use any power / CPU. If it does it is a strong indication you have a script in your editor that takes all that power and you should profile the unity editor to see where most CPU cycles are wasted
Here an example of a large project (>20GB) opened in the Unity Editor:
I have the same CPU but it does not spawn 55 threads - so this seems odd. When entering play mode only 4 shader compilers are spawned, but maybe this depends on the amount of shaders you are having
One thing I’ve noticed is some components may dirty themselves a lot, especially from assets (I’m looking at you Animancer). This can mean the Editor redraws itself unnecessarily all the time unless those components are folded up. If you notice a difference between having the Inspector open for this/that object then it may be a hint this could be a factor.