I noticed this only happens when I start profiling with the “Hierarchy” mode. Switching it to Timeline resolved the issue for me.
The system is running out of memory. Please close applications to free memory or free up space on th
Still on M1, version 2021.2.17
That’s odd, the original bug is verified to be fixed in 2021.2.13f1. Could you please file another bug for it via the Editor menu Help > Report a Bug? There could be some case that’s been missing from that fix but we’d need some context on to diagnose and fix. ![]()
Unity 2021.3.0f1 :
The system is running out of memory. Please close applications to free memory or free up space on the partition where the pagefile is located.
Used memory (physical and paged): 93% (25028MB of 26761MB).
Discarding profiler frames data.
That sounds close enough to memory pressure to be legit a reason to drop frames. We’d only ba able to fix this by changing the profiler data stream to be ring-buffered to disk instead of fully retained in RAM. We eventually want to do something like that, but that’s a feature, not a bugfix.
To work around this, you could close other applications, reduce the amount of retained frames in the Profiler Preferences, close Profiler Modules you don’t need, only run deep Profiling when needed and e.g. to find GC Allocs use Allocation Call-stacks instead of deep profiling.
I close tab Profiler, FrameDebug and issue was gone.
i second this, doesnt work for me either
Currently on 2020.3.17f1 with an M1 Macbook and experiencing this issue. Any idea if a backport is planned for 2020.3 LTS?
Has happened twice since Saturday with 2 clean installs of most recent 2021 LTS, pretty annoying.
2020 LTS is done, it’s not getting any more updates.
Sorry about the way too late reply.
In the comments to the original bug report it says it was backported to 2020.3.31f1
I’m not sure if any follow up bug report was ever filed and fixed as if it did, I can’t remember it reaching the profiler team (could have been on another team or I could’ve been on vacation?)
So if it is an issue that was not fixed as part of the original fix then @AcidError is correct and a new backpoet won’t happen anymore.
So the same issue of it giving that warning even though there is still reasonably enough space in ram?
As I said, I’m not aware of any further bug reports so it might express the same but be a new/sperate issue. If that is to ever be fixed, someone is going to have to file a bug report for it.
Just noticed that this was originally a VR thread, which I am not doing.
For the bug report stuff, I don’t get the opportunity to submit it – as it just slowly eats up more memory and the overall process could take 30+ minutes.
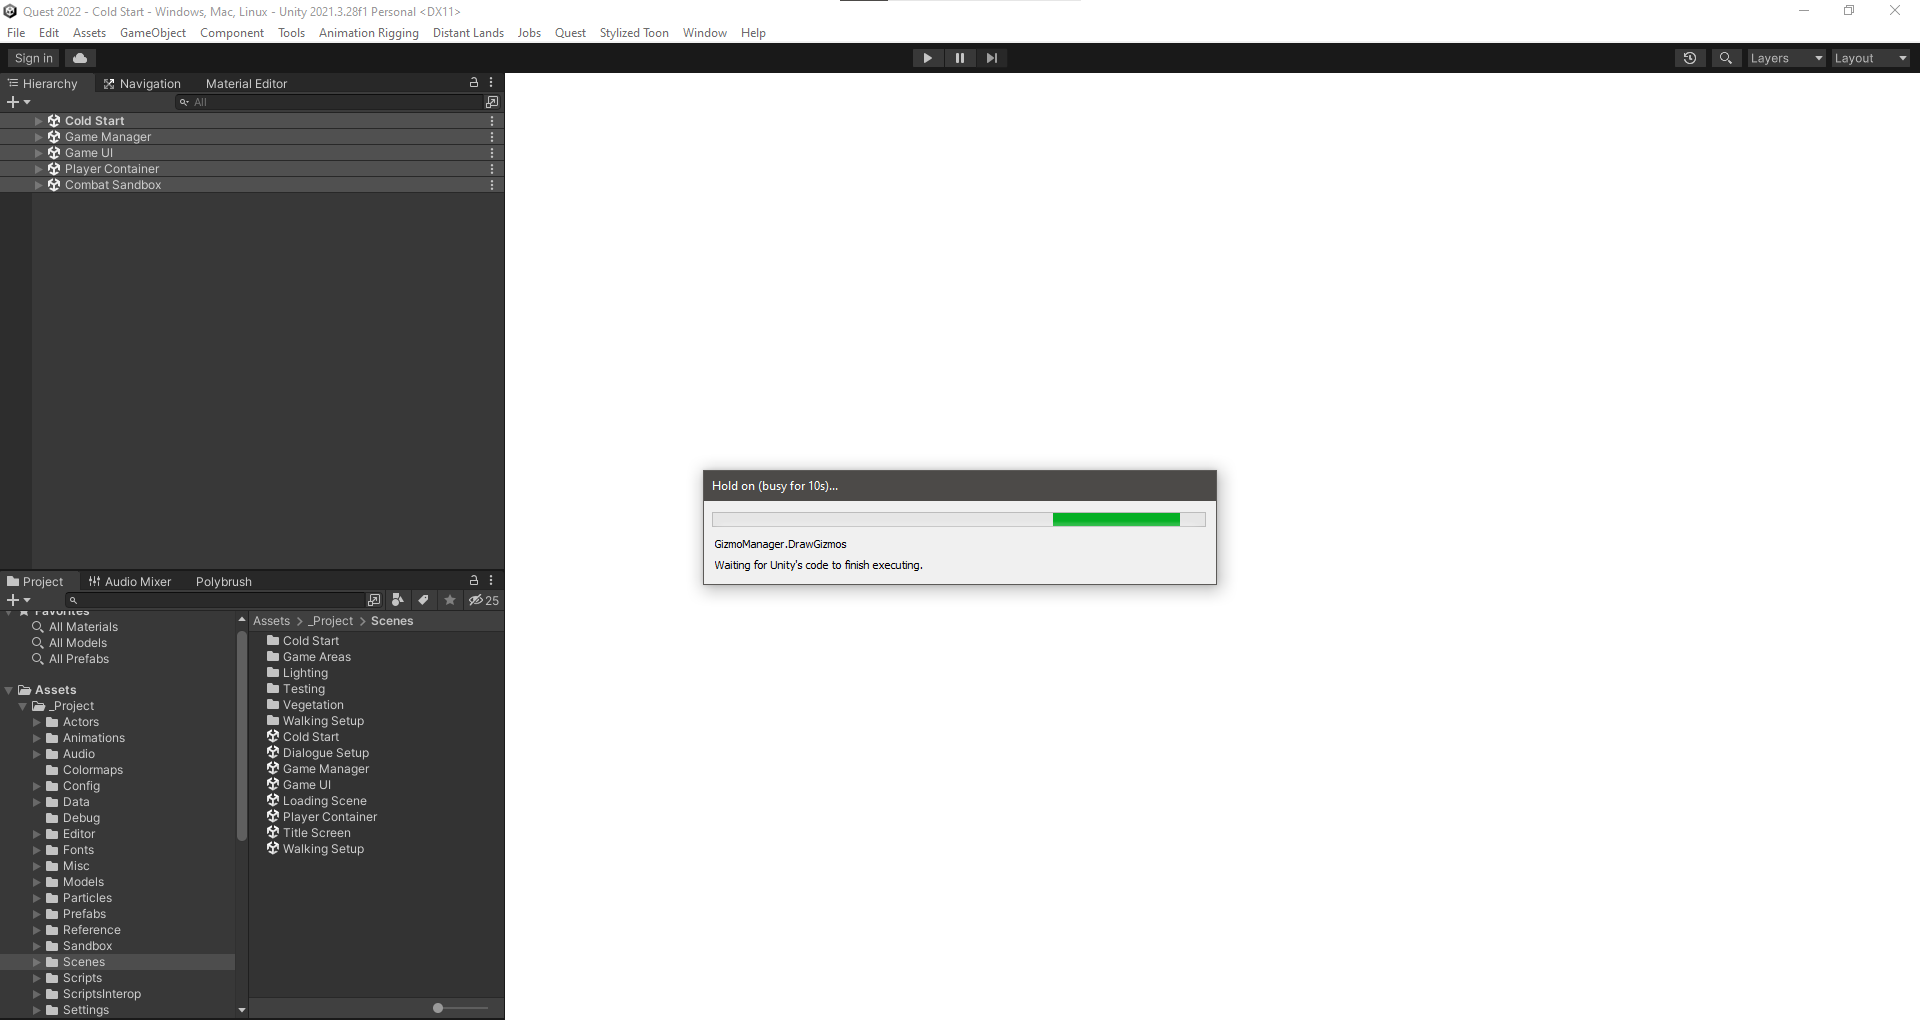
For the actual issue popping up again, I left PC on overnight to re-index assets after a clean install, entered playmode for a few seconds, stopped playmode, and got this Gizmo message for (going on) 10+ minutes now:

Once this happens, the editor hangs on that same cryptic gizmo message whenever I open the project, seemingly stuck halfway through drawing its windows.
This has happened the last 3 times I’ve had a clean install and tried to just leave playmode, so I’m not sure what all is going on here.
For the general bug report questions:
- The issue is isolated to this project
- A clean install editor install + version control backup does not fix it
- No gizmo code has been changed or introduced lately
Will leave the editor going like this until it hopefully dies and presents a bug submission form.
Any help would be appreciated, thanks team. o7
You can start the bug reporter directly. Find it in your Unity Installation under e.g. C:\Program Files\Unity\2023.2.0a21\Editor\BugReporter\UnityBugReporter.exe
It will typically automatically select the last Editor.log and Editor-prev.log file, and when started this way will likely need to be directed at the problematic project. If that project is too large to upload, you can also zip it up and write in the bug report that you would like to get a link where you can upload a larger file to it, and then upload it once you get a reply.
This sounds like the issue is somewhere outside of the Assets or otherwise version controlled folders, like the Library folder. Once you have backed up a copy of the project (or at least the Library folder) for the bug report try deleting that folder.
There are other folders outside of your version control that could be related, like some temp or caching folders (e.g. shader cache) but that seems less likely to be the issue here. If deleting library folder does not resolve it and while waiting for a response for the bug report, you could try attaching Visual Studio (or whatever IDE you use) and hit pause to see what it is executing. There’s a chance that it’s going to be native code or generally something with low visibility for you, but it might be a shot at getting a better understanding of where it is failing. The Editor log could maybe also help?
actually, on second though, gizmo drawing does relate to shaders so… maybe it IS something broken in the shader cache?
I’ve been clearing those out with each clean install, although I did try just now to manually delete the non-vc shader files and still got the hanging.
The issue does seem to be with shaders though, as I could enter and leave the project without issue prior to adding the player’s scene and viewing in the Game window. Afterwards, the Gizmo call hangs and Editor is unresponsive.
Submitting a manual bug report now, thanks for the bug report exe path. o7
Well I submitted the bug but found the issue 5 minutes later – so pretty standard etc.
The issue was that I have a trajectory visualizer that uses the Gizmos utilities to draw how something will behave at runtime. Part of that code includes something like this:
var elapsed = 0f;
var duration = projectileSpell.maxProjectileDuration;

while (elapsed < duration)
{
    // Simulate Movement

    elapsed += Time.deltaTime;
}
Since I had never seen Time.deltaTime evaluate to exactly 0, this seemed fine. Indeed, googling “Can Time.deltaTime be zero” either tells you flat out that it cannot, or points to a situation where someone accidentally set their time scale to zero.
In my case, it became zero for at least 4 situations:
- Loading a scene
- Entering Play Mode
- Pausing Play Mode (arguably expected?)
- Leaving Play Mode
So if you are going to use Time.deltaTime in your Gizmos calls, be sure to check that your code isn’t secretly assuming a non-zero dt.
Just had this appear for the first time in 2022.3.1f1. Been running Unity for 30 minutes and on this play through, this error appeared. It appeared each subsequent play through. Memory use in Task Manager was 2 GB out of 16 GBs RAM. Nothing else running except a couple of browser windows. It was moaning about the pagefile. Plenty of space free on drive C.
Restarted Unity and currently it’s gone.
There have been several more or less severe memory leaks in 2022.3, most of which are fixed in 2022.3.10f1, [an additional fix to the job system scheduler landed on 2022.3.14f1]( https://discussions.unity.com/t/784527 page-4#post-9453287), so you may want to update.
Hi, I’m encountering this same issue on 2019.04.35f1, my used memory is at 56%, M2 Mac - any chance anyone might have insight into this?
Have you looked at this with the Memory Profiler?
You can take a snapshot in 2019 and open an empty project in 2022 with version 1.1 of the com.unity.memoryprofiler installed, import the snapshot and explore it there.