Hi,
I’ve been encountering a few recurring extreme lag spikes (200ms+ mostly) that only occurs while in builds, and does not happen in editor. I’ve spent some time looking for the root cause of this in the profiler, and I’ve tried various different ways to try to resolve the issue with no luck. I apologize if a solution already exists somewhere, but I’ve tried to search for the various things that came up and nothing seems related to my issue, or perhaps I’m searching for the wrong things. Here are more details:
Unity version:
2022.3.15f1 LTS, was upgrade from 2020.3.34f1, but spikes existed before upgrade, just hadn’t got round to profiling properly yet
PC Spec:
Intel i7 13700k CPU
Nvidia RTX 4090
32GB ram
PCIE Gen4 SSD with hundreds of gigs free
Background info:
This lag spiking seems to be occuring both in game and in menu screen, so I chose to fix the menu scene first as it’s much simpler. After carefully profiling a build version with every permutation of root GameObjects in the scene enabled/disabled, I have come to the conclusion that there are 3 different recurring types of lag spikes happening:
-
First type of spike is labeled “others” in profiler which happens randomly with no pattern (Perhaps once every 5-10 seconds on average), and is shows nothing out of the ordinary in the profiler. Everything in the Raw Hierarchy showing less than 1%, but in the timeline, there is a massive gap of hundreds of milliseconds where literally nothing in any of the rows (Main Thread, Render Thread, Jobs etc…) does anything. This particular type of spike remains regardless of whether the camera is enabled or not, and is persistent even when every single root GameObject (including camera) is disabled in scene.
-
Second type of spike appears to be caused by the rendering pipeline, and I only seem to see this if the camera is disabled (Again, with no detectable pattern perhaps once every 5-10 seconds average). I can see that GraphicsSettings.get_currentRenderPipeline() is the cause of the issue, but sadly beyond that, I have no idea why it’s happening nor why having everything disabled in the scene will still cause 180ms of latency in rendering.
-
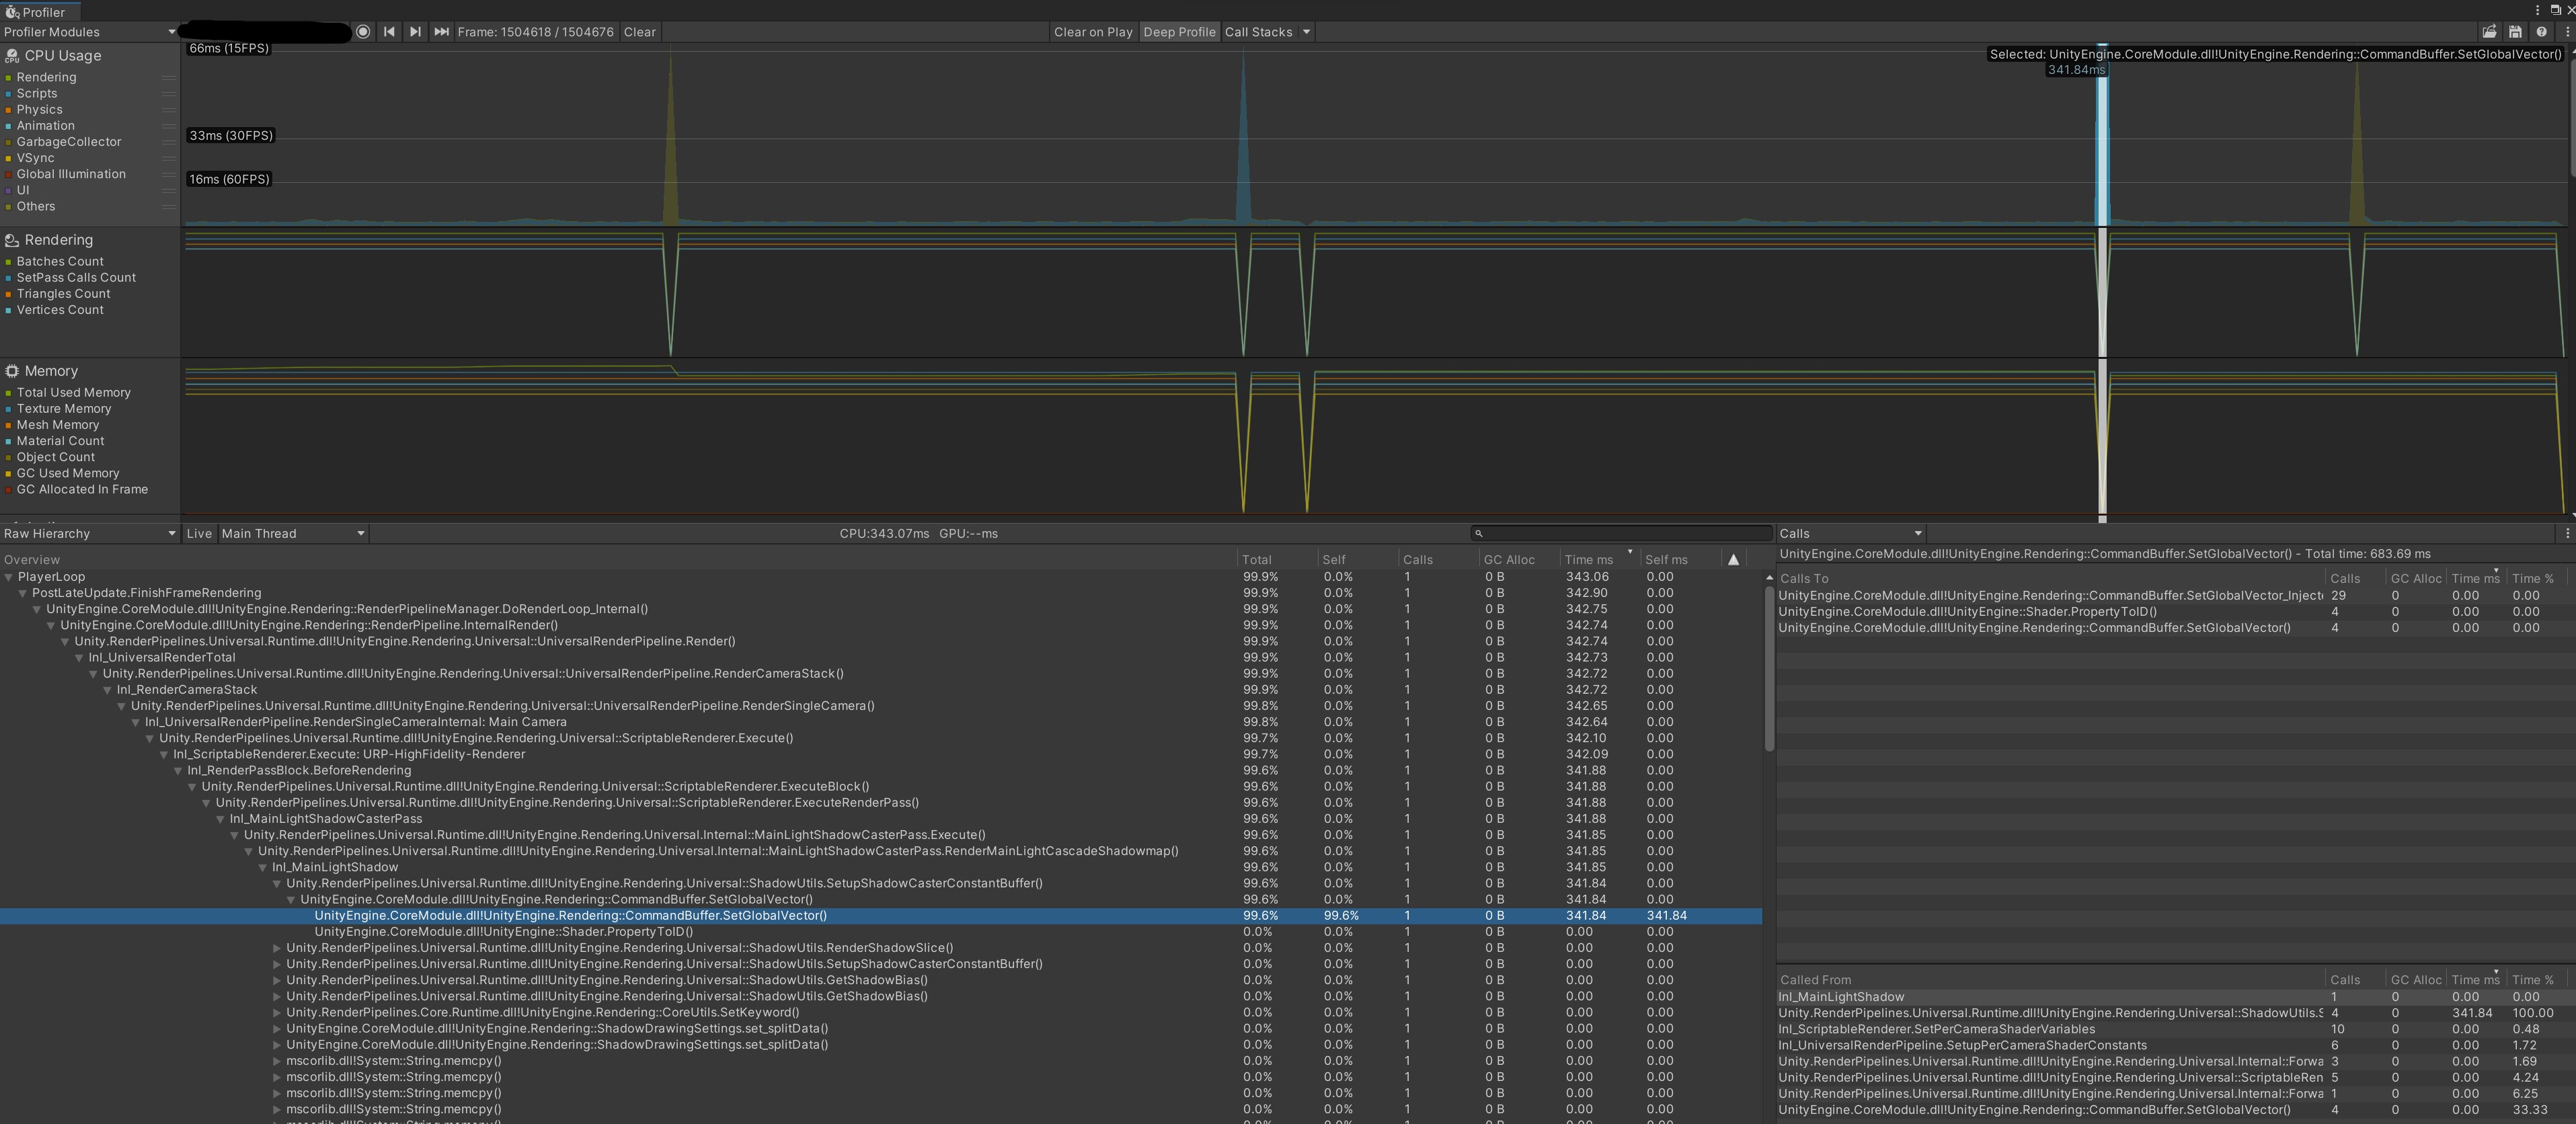
The final type, which consists of many different types of root causes according to profiler, are all related to the main camera. These spikes only happens when the camera is enabled (Only 1 camera in scene), but even when all other objects are disabled these spikes still happen. (Can only show 3 here because of image upload limit, but will post the other 3 in a reply) Note that these happens much more regularly than the other 2 types, even after accounting for the fact that there are more than 1 source, perhaps between 1-5 every few seconds, again with no decernable pattern.


Things I’ve tried:
As mentioned at the beginning, I’ve tried the permutations of enabling/disabling certain objects and camera in the scene, and its effects are noted above in the spike type descriptions. I have also tried to investigate into my camera and URP settings, and have tried the following with no effect:
Camera settings:
- Turning post processing on/off
- Turn render shadows on/off
- Turn occlusion culling on/off
- Set Target Eye to None as the game is not VR
URP settings: - Turning transparent receive shadow on/off
- Turning post-processing on or off
- Turning SSAO on/off
- Turning a custom render feature on/off
Others: - Also mentioned at the start, these spikes only happen in builds. Obviously I have the editor overheads when I profile in editor, but I don’t see these multi-hundred millisecond spikes at all.
Things I couldn’t try:
- As many of the spikes were caused by the Renderer/Camera sub-systems, I really wanted to be able to catch it in the frame debugger, and see exactly what object/render process causes the problem, however, despite much trying, it was impossible to press “Enable” at the exact frame where one of these issues occured.
My thoughts:
The fact that there are so many different systems with such extreme lag spikes that seems to have a processing time relatively similar makes me a bit suspicious that something else is going on here, and I think we can all agree 200-400ms is a VERY long time in most contexts, but esecially so when it’s still the case in a scene with everything disabled except the camera. But I’m at a complete loss at this point and I have no idea how to proceed next.
I hope this is enough information (There will be other supporting information that I will be posting in a reply due to image upload limit), but I can provide any further info or test anything if required. Thanks in advance!