It seems that interface got even slower, especially when dragging with MMB, takes almost a second before it starts. Does the grid have something to do with it?
It took me a while to figure out how to record middle click (theres no option to record MMB, so I right clicked right after holding mmb)
I use dark mode as you can see. The delay was shorter on 1.0.11, I’m pretty sure. It doesn’t happen on a new graph, but becomes apparent after a few nodes added in.
There is also a delay while zooming, but not as much.
I should probably mention, shader graphs don’t have such problem on my end.
Ah yes, we have a ticket for the middle mouse click actually. It just has not been prioritized yet.
We do not have one yet for zooming though so thanks for reporting.
This slowdown was also there before the 1.0.12 release, It’s interesting that it’s slower now though.
We should be investigating a new version of AppUI in Behavior soon to release in one of the next patches which might help, but we need to investigate. I’ll let you know if it does, if it doesn’t help, I will try to see what we can do to look into this further.
I checked zooming more and it’s quite peculiar. It will take me a while to explain
So dragging have a delay before each activation, but zooming is slow only after first activation. So once I zoomed once, it’s smooth after that.
It seems that zooming delay is connected to dragging delay somehow, since once I use dragging, the next zoom activation is slow again. Hope it makes sense. I’ve no idea how it all works but seems like activating drag resets zoom caching or something.
Would be nice to have a “Create New” button on the graph agent. It’s a pain to have to do 3 click + navigate an entire list just to create a new graph.
Would be nice to have a blackboard asset inspector from which you can see the BBV without having to open it. Also having a shortcut to copy GUID. (Yes you can do that by going into the Runtime asset directly, but it’s error prone and too much step).
Behavior Asset is missing asset icon next to the tab name. Same for blackboard asset.
One bug I found while working with this version is that, properties of actions are not visible, even though I have created them using [CreateProperty]. Is there something wrong I am doing ?
Only BlackboardVariable whith T being numerics, string, Vectors and UnityEngine.Object derived type are supported by the serialization. Make sure to make them public and to add [SerializeReference]attribute.
[CreateProperty] is only used for Runtime Serialization, not for editor/authoring serialization.
Could you make Debug the same way as in Animator via “Auto Live Link” (always debug selected gameobject) instead of selecting via dropdown menu?
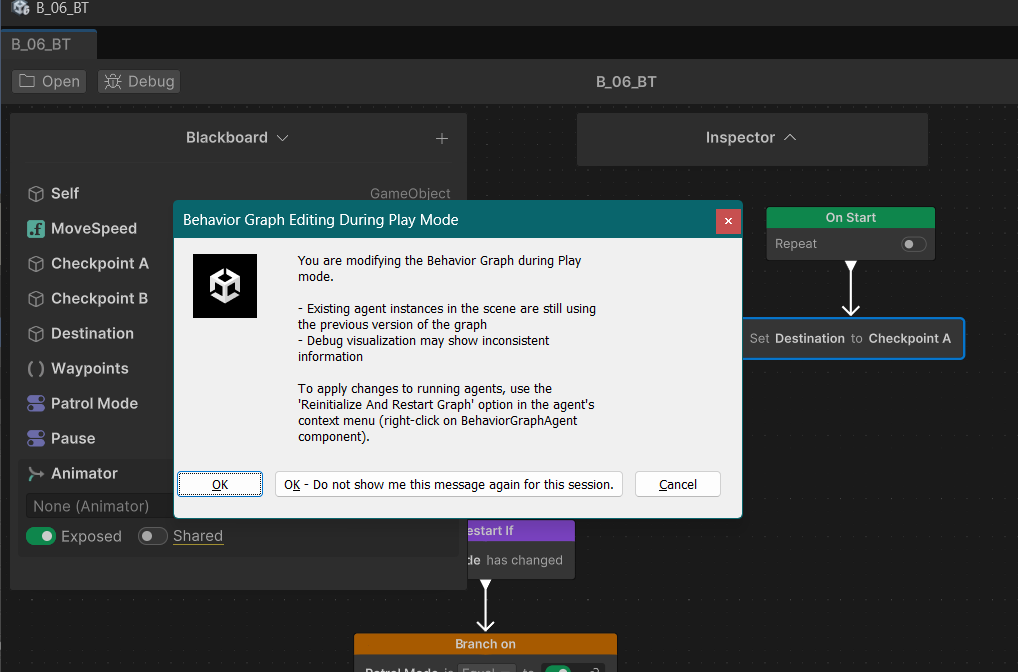
Also, (Outdated) is not very clear, I’ve accidentally moved the nodes during playmode and it got me confused.
Thanks for the “Auto Live Link” suggestion. Will bring up to the team.
The (Outdated) is part of the new playmode support. We haven’t had time to create a new documentation page on the topic, but you should get this message popup when editing a graph during playmode:
(Outdated) means the graph running on an agent is not up to date to the graph in the graph window.
It is still possible to attached to an outdated agent and any identical parts will still be debuggable. New or deleted section however won’t run because the agent needs to refresh its graph instance.
Also, please note that you can Lock Animator window to stay on last selected object, and it also doesn’t break the link when selecting object without Animator (when Lock is not used) or clearing the selection (by clicking on empty space in project for example). I’d expect the same behavior, and you can also have improvement by always showing what object is being debugged (next to debug button?) via clickable reference. Animator has the name of linked object at the bottom, but you can’t click it to focus in hierarchy.