Identifying GPU bottlenecks with Metal frame capture
You have been profiling your game, trying to figure out why it is not hitting your target frame rate, and you have found that the GPU is the bottleneck. You may have some ideas about how to optimize your game’s rendering, like using LODs, minimizing overdraw, and reducing the number of draw calls. But before putting in the work, how can you tell for sure which optimizations will improve performance in a meaningful way?
As part of my work on the Unity Consulting team, I get to see all kinds of Unity projects while helping studios optimize the performance of their games. One of the trickier areas to investigate can be GPU performance, as it can require a lot of detective work to pinpoint performance bottlenecks among the large amounts of data that GPU frame capture tools provide.
In this article, we will use Xcode’s Metal debugger to analyze GPU workload, and identify common GPU bottlenecks. The official documentation for the Metal debugger can be found here. The GPU frame captures in this article are taken in the Fantasy Kingdom demo on an iPhone 13. Note that older devices may not support all the features of Xcode Metal frame capture, so some profiling data may only be available on more recent devices.
Taking a Capture
As the Metal frame capture functionality is built into Xcode, no additional software is required.
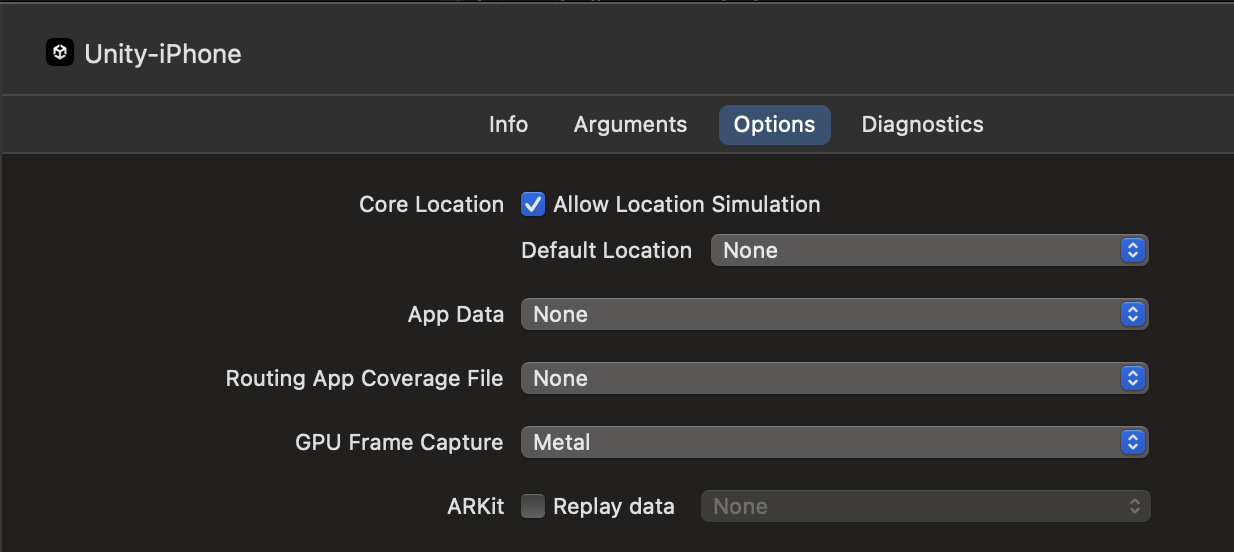
To take a frame capture, ensure that the ‘GPU Frame Capture’ setting in ‘Product > Scheme > Edit Scheme’ is set to ‘Metal’.
Build and run your application in Xcode. A button with an ‘M’ icon should appear in the bottom debug panel. Navigate into the area of your project that you want to profile and then press this button to initiate the frame capture process. You can choose to capture just one frame, or multiple frames in sequence.
In this case we will capture just one frame.

After some processing, Xcode presents a summary page which contains high-level performance metrics for the captured frame. For example, we see that our frame takes a total of 23 ms to render. There are 908 draw calls in the frame, and 6.157.158 vertices processed.

Performance Overview
Let’s first try to identify which part of our frame takes the longest to process.
Navigate to the ‘Performance’ page in the top left menu to see much more detailed performance metrics. The timeline view shows the duration of each render pass, as well as a timeline of the frame’s shader programs, with vertex and fragment stages on separate timelines. There is also a timeline for compute passes, although we won’t be discussing these in this article.

In this view, in the list of ‘Encoders’ to the left, we see that the ‘RenderLoop.Draw’ pass takes 39% of the total frame time, so this is a good place to start looking for potential bottlenecks.
The Vertex stage for RenderLoop.Draw takes 5.15 ms, while the Fragment stage takes 3.47 ms. Since the vertex stage takes the longest, we should start by identifying bottlenecks in this part of the pipeline. We will look into the fragment stage later to see whether any improvements can be made there.

Note that these render passes are parallelized when possible in order to save time. For example, in this frame capture, the fragment stage of the RenderLoop.Draw pass is executed in parallel with the vertex stage of the MotionVectors pass (blue block to the right of RenderLoop.Draw). Whether render passes can be parallelized depends on the resource dependencies and type of render pass. Users can usually not control the submission order, and Unity will make sure that render passes are submitted in an optimized order.
The Vertex Stage
The vertex stage is the part of the render pipeline where the vertices of our geometry are processed, so that we can determine where the geometry is located on-screen. This information is used later by the fragment stage to produce fragments to output to the display. If you’re unfamiliar with render pipelines, here is an overview of the OpenGL render pipeline.
The vertex stage performance depends on two main factors:
- The number of vertices that the GPU needs to process.
- The complexity of the vertex shader programs.
It can be difficult to determine a specific number of vertices that is too many, as vertices are not necessarily equally expensive to process. The number of vertices that the GPU can process efficiently depends on the shader programs that process each vertex, so always compare the number of vertices to the complexity and efficiency of your shaders. As a rule of thumb, use the smallest number of vertices that can produce the desired visual quality.
Shader Performance Metrics
Let’s investigate the complexity and efficiency of our vertex shaders. GPUs are highly optimized for performing mathematical operations in parallel, which allows them to process many vertices and fragments at the same time. However, some situations can arise that prevent the GPU from executing all of this work efficiently. GPUs have different processing units allocated to specific types of work. For example, texture access, math operations, and rasterization all use different processing units.
If one unit is used too heavily, it will run out of resources, and shader programs that rely on that unit will need to wait until it is ready to proceed. Note that the information in the following sections also applies to fragment and compute shaders.
GPU Occupancy
GPU Occupancy is a measure of how many GPU cores are used to perform vertex shader work compared to the maximum capacity of the GPU. Occupancy indicates how well the GPU is being utilized, and a high occupancy is generally good, as it means that the work performed uses more GPU cores. However, both very high and very low occupancy for prolonged periods of a render pass could warrant further investigation, and should be interpreted in context of other metrics.
For example, prolonged periods of low occupancy can indicate that the GPU often has to wait between instructions, and has no other work to do while waiting. Prolonged periods of 100% occupancy, meaning that all available GPU cores are in use, can be an issue if GPU instructions are competing for memory access, as this would cause stalling. A much more detailed explanation of GPU Occupancy can be found in this article.
First, we should check the ‘Vertex shader occupancy’ in the timeline view. The vertex shader occupancy is around 7% during the RenderLoop.Draw pass, which is very low, and the vertex stage takes 5 ms, which is fairly long. This could be an indication that the GPU is not processing vertices very efficiently, and we should investigate this further.

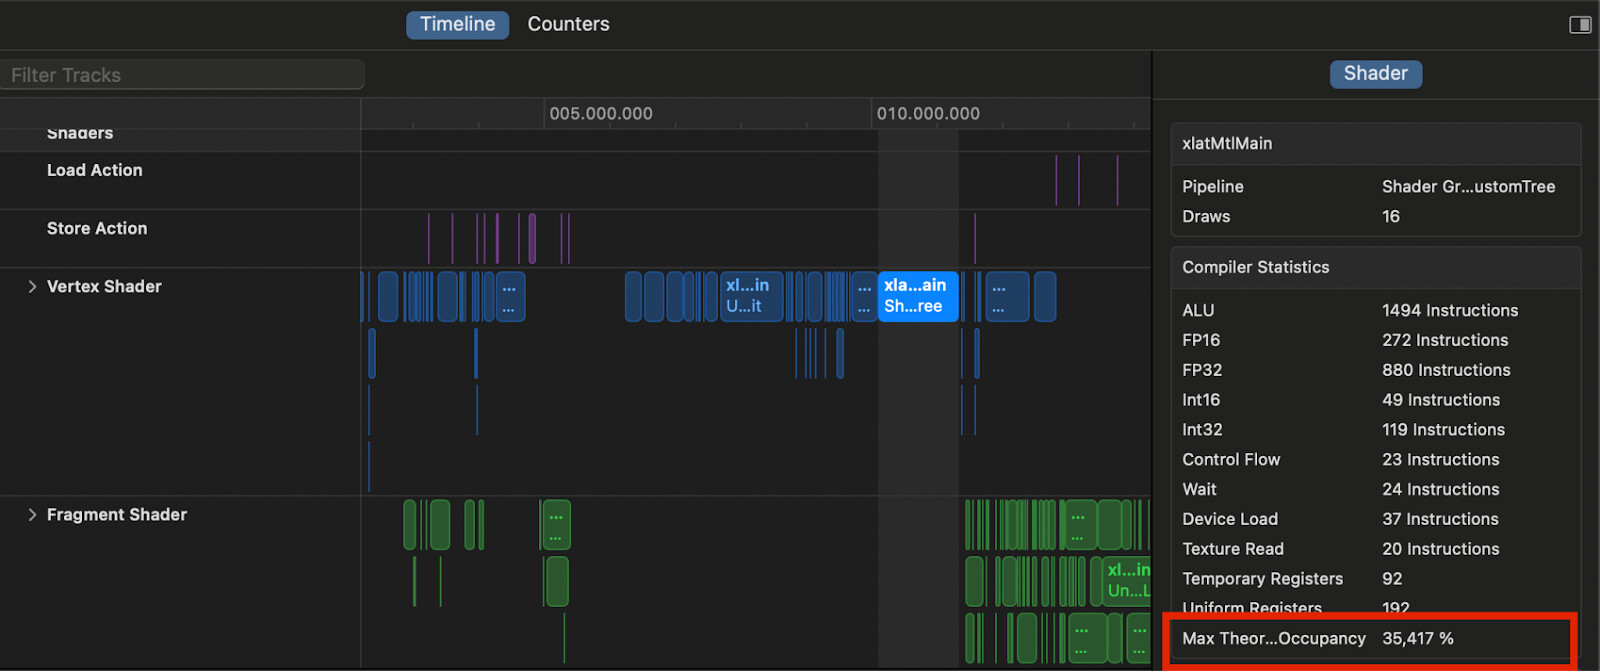
Note that occupancy will be limited by the maximum theoretical occupancy of each shader program, which is determined by how many registers are required by the shader for various types of instructions. This number can be found by selecting a shader program on the performance timeline, on the right hand side, under ‘Compiler Statistics’. When inspecting the vertex shaders in our RenderLoop.Draw pass, we find that they all have between 35% and 45% maximum theoretical occupancy. This is still much higher than the 7% that we observe for the render pass.
Utilization and Limiter counters
To continue our investigation, let’s look at Utilization and Limiter counters for various processing units during the vertex stage. Utilization counters describe how much actual work a unit is performing, compared to the maximum theoretical workload of that unit. Limiter counters show how much work a unit is performing, but also include how much time that unit stalls, being unable to continue working.
Generally we want to see a high value in utilization counters, as this means that work is being performed efficiently. However, if we see a high value in a limiter counter, paired with a low value in the corresponding utilization counter, that would indicate a stall in that processing unit.
We can check the utilization and limiter counters over the duration of the RenderLoop.Draw pass in the Timeline view.
Vertex shaders often rely on ALU (Arithmetic Logic Unit) operations to calculate vertex shader output such as vertex positions, normals, and UV coordinates, so let’s first check the ALU limiter and utilization counters. In the RenderLoop.Draw vertex stage, the ALU limiter and ALU utilization counter range between 30% and 40%, and the discrepancy between the two is rarely above 1%.

This means that there are very few stalls happening when performing ALU instructions, but that the overall ALU workload could be more efficient. In the ‘Vertex Shader’ tab in the ‘Counters’ view we can examine the distribution of the various types of ALU operations. This distribution is important because some ALU operations are more expensive to process than others.
The RenderLoop.Draw pass has a total of 615 million ALU instructions across 856.000 vertex shader invocations. This equals roughly 720 ALU instructions per vertex, which is a fairly large number.
‘ALU Float Instructions’, which account for 45% of ALU instructions, are twice as expensive to perform as ‘ALU Half instructions’ which only account for 8% of the total instruction count.

Using 32-bit float precision as a baseline, ALU operations are performed at the following relative speed:
- 16-bit floating point (half): 2x
- Integer add/subtract/conditional: 2x
- 32-bit floating point (float): 1x
- 32-bit integer: 0.5x
- Complex (sqrt, log, exp etc): 0.5x at best, but often slower.
Given these operation rates, we should aim to replace as many 32-bit floating point operations with 16-bit as possible, and try to eliminate some of the complex operations in our shader code. Note, however, that using 16-bit float precision for some vertex attributes such as positions can introduce artifacts such as z-fighting, especially when mesh surfaces are closely aligned or overlapping.
Inspecting Shaders
We can inspect each shader program to get an overview of the GPU workload on a per-line basis. To do so, control-click a shader program on the performance timeline and select ‘Open Shader’.

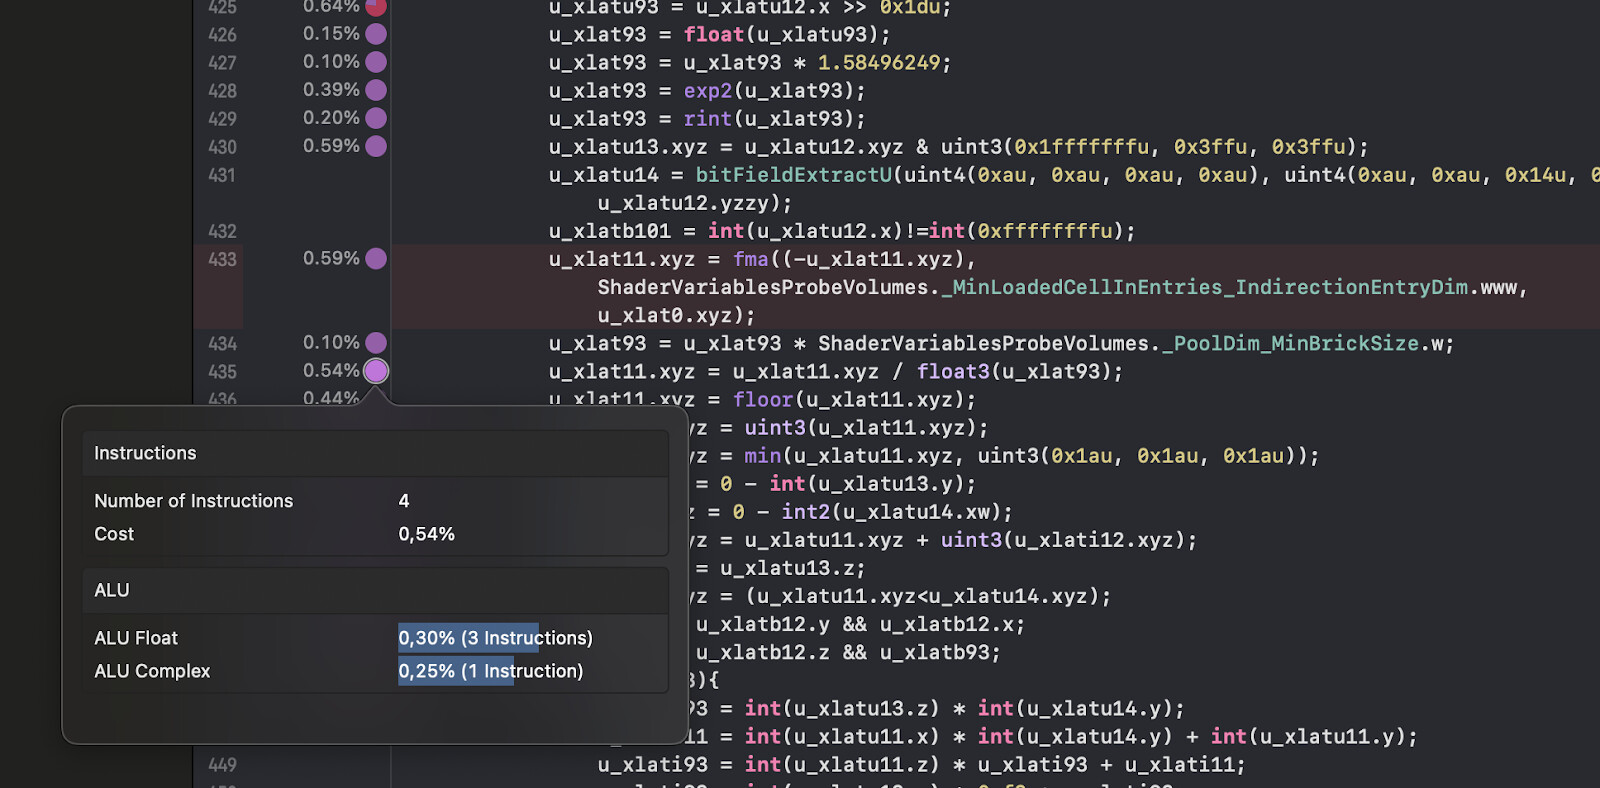
In the shader program view we see the compiled version of the shader. We can see the relative cost of each line of code, and if we hover over that cost, we see a breakdown of the type of instructions that the line contains.
Browsing through the URP/Lit shader, we find a large number of instructions that calculate the output of Adaptive Probe Volumes. Some of these instructions are marked as memory access from Texture3D sampling, which accounts for 12% of the execution time, while most other instructions are ALU instructions.

As a test we have made another frame capture from a build where Adaptive Probe Volumes are disabled. In this capture, the RenderLoop.Draw vertex pass renders in 2.9 ms, which is 2.1 ms faster. The total number of ALU instructions is down to 272 million, from 615 million.

We can attempt to lower the cost of rendering Adaptive Probe Volumes by tweaking various URP renderer settings. For example, in scenes with very high vertex count, it may be more efficient to render Adaptive Probe Volumes per fragment rather than per vertex. Alternatively we could exclude this feature from rendering on lower quality tiers.
Buffer Access Stalls
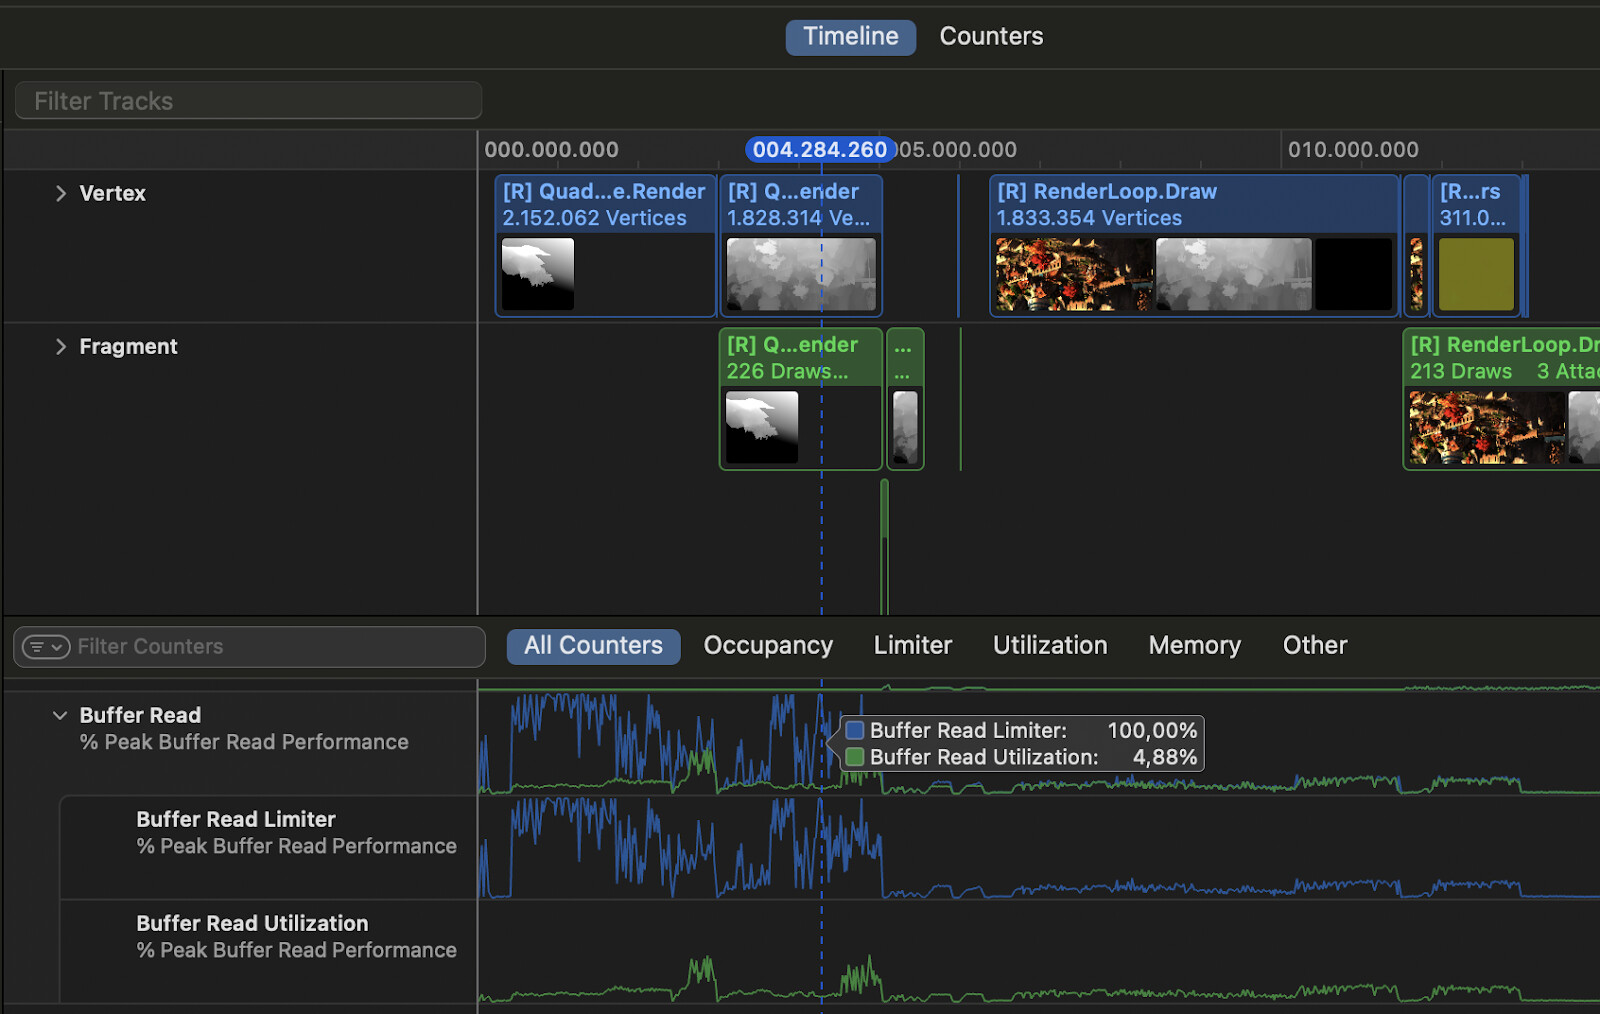
A clear example of where we have a discrepancy between limiter and utilization counters can be found a bit earlier in our frame, during the depth prepass and shadow-caster pass vertex stages. Here, ‘Buffer Read Limiter’ is often much higher than the ‘Buffer Read Utilization’ counter, and often at 100%, which indicates that we are trying to read from buffers but unable to do so due to high traffic, meaning that we are very frequently stalling.
We can zoom in on the timeline, by holding the option key and scrolling, and find which shader program is executing when the Buffer Read limiter is high. Selecting this shader on the timeline will reveal some statistics on the right side of the screen. An interesting statistic is that this shader spends 59% of the time on ‘Wait Memory’.

If we inspect the shader program, we see that 68% of the shader program’s execution time is spent on a single line that fetches a value from an array. 61% of that time goes towards ‘Sync Wait Memory’, which indicates that the GPU is waiting for data to be retrieved. In this case we are retrieving data from DOTS instancing buffers, which the GPU Resident Drawer feature relies on.

The GPU can normally continue execution of the rest of the shader program while waiting for the requested value from memory, as long as the next instructions do not rely on the value being retrieved. In this particular case the vertex shader does not do too much work besides accessing these constant buffers, so this bottleneck is hard to avoid, and these stalls can be seen as a false positive. Additionally, even with this buffer access bottleneck, the vertex stage is processed 1.3 ms faster than when the GPU Resident Drawer is disabled.
In a case where there is plenty of other work to do in the shader program, but you still find that access to one of your buffers or arrays is a bottleneck, consider the following options:
- Use the lowest precision and size of data type necessary for your array. For example, consider using half4 instead of float4 for an RGBA color value.
- Combine multiple arrays into a single array if all of the arrays are accessed in the same shader. For example, use a single float3 array rather than three separate float arrays.
- Consider whether some data can be stored and accessed as a texture instead. This will offload some of the work as texture operations, but keep in mind that this may worsen performance if textures access is already a bottleneck, so make sure to profile performance before and after this change.
The Fragment Stage
The fragment stage is where we render to the pixels of the render target, based on the geometry that was generated by the vertex stage. The fragment stage is likely to be the bottleneck in 2D games, or games that make heavy use of post-processing, VFX, and complex lighting setups. Similar to the vertex stage, long fragment stages are typically caused by a combination of two factors: The number of fragments rendered, and the fragment shader complexity. However, a large number of fragments can be caused by several underlying issues, such as overdraw and micro triangles, which we will discuss in the following sections.
Number of Fragments
The number of fragments rendered by each pass can be found in the ‘Fragment Shader’ tab of the Counters view. The ‘FS Invocations’ column shows how many times any fragment shader has been invoked, so this number excludes fragments that were discarded by early depth testing. Generally, we want to keep the number of fragment shader invocations as low as possible.

In this capture, the RG_FinalBlit render pass has the most fragment shader invocations at around 6 million. This pass copies the contents of the render target to the frame buffer, and then renders UI. The iPhone 13 dimensions is 2532x1170, so the total number of pixels on the display is ~3 million. Very little UI is shown in this frame, so why are we rendering two times the number of pixels on the display in this pass alone?
Looking through the draw calls for the RG_FinalBlit pass on the left-hand side, we find one draw call that covers the entire screen, and uses the ‘UI/Default’ shader. For some reason an UI image is rendering completely transparent pixels to the entire screen for a total duration of 0.5 ms!
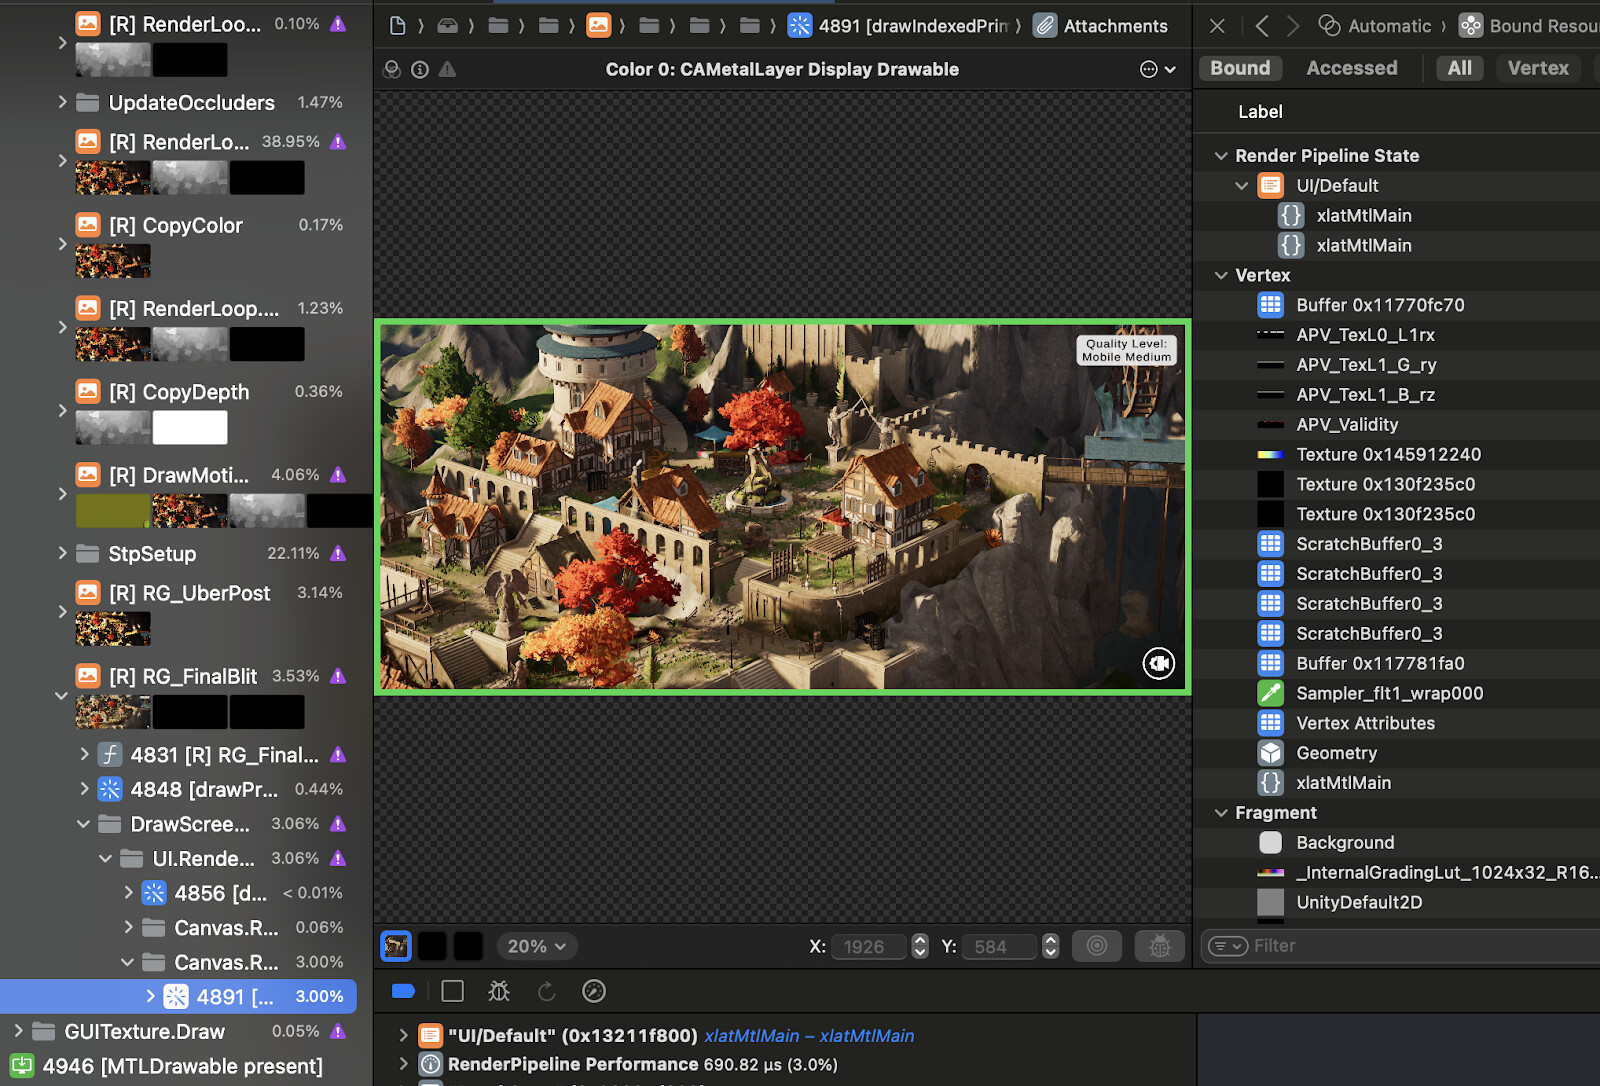
This is a more common issue than one might think, as developers often leave UI Image components enabled for rendering, even though their alpha value is 0. A common example is UI menus that remain completely transparent until user input prompts them to be faded in.
Keep an eye out for draw calls that produce completely transparent pixels, and disable them. Also look out for partially transparent draw calls. Sometimes textures such as UI sprites or foliage have some extra padding that could be trimmed away.
Full-screen render passes such as post-processing will render to each pixel of the render target, and are likely culprits of a high number of fragment shader invocations. In our case, all of the post-processing has been combined into just one fragment shader invocation per pixel on the display in the pass ‘RG_UberPost’. The built-in post-processing for URP combines most of the post-processing effects into the same shader program, and compiles multiple variants at build-time to strip unused post-processing effects from the shader code. Some effects like bloom will require extra render passes. This approach is also known as an ‘Uber shader’.
The downside to this approach is that having a large number of post-processing features will result in many compiled shader variants. However, Unity ensures that only the feature combinations that are used in Volume Profiles are compiled. If you choose this approach for custom post-processing features or other full-screen passes, see the Strip shader variants Unity manual page for more information on how to keep the number of shader variants in check.
Overdraw
The number of fragments rendered in each pass should ideally be as close as possible to the number of pixels on the display, or less. However, with complex geometry and transparent objects, this can be very difficult to achieve. In a Metal frame capture, this number is provided to us in the ‘Fragment’ section of the Counters view as ‘Average Pixel Overdraw’. In this capture, this number is 1.2 for the RenderLoop.Draw pass, meaning that each pixel on the render target is rendered 1.2 times on average. This is a very healthy number, which can indicate that the scene has few overlapping objects, that proper early depth testing is taking place, or a combination of these.

There are several reasons why a game might have a large amount of overdraw. Most commonly, a large number of transparent objects, such as UI and VFX, will cause overdraw. If your render pass has a high average pixel overdraw, consider whether the scene has too many transparent objects, and remove some if possible. For example, consider whether ParticleSystem components could emit fewer particles, whether layers of UI images could be flattened, or whether UI images contain empty space that could be trimmed.
Opaque objects can also cause overdraw if the shader does not perform early depth testing. Opaque objects are usually depth tested to ensure that the render order does not impact the visual result for overlapping objects, and as an optimization to prevent overdraw. But it is only an optimization if the GPU can perform the test before the fragment shader, rather than after. In some cases when using alpha clipping, the shader program will no longer support early depth testing. Instead, the depth test will be performed after the fragment shader, and thus, no work has been saved by the depth test.
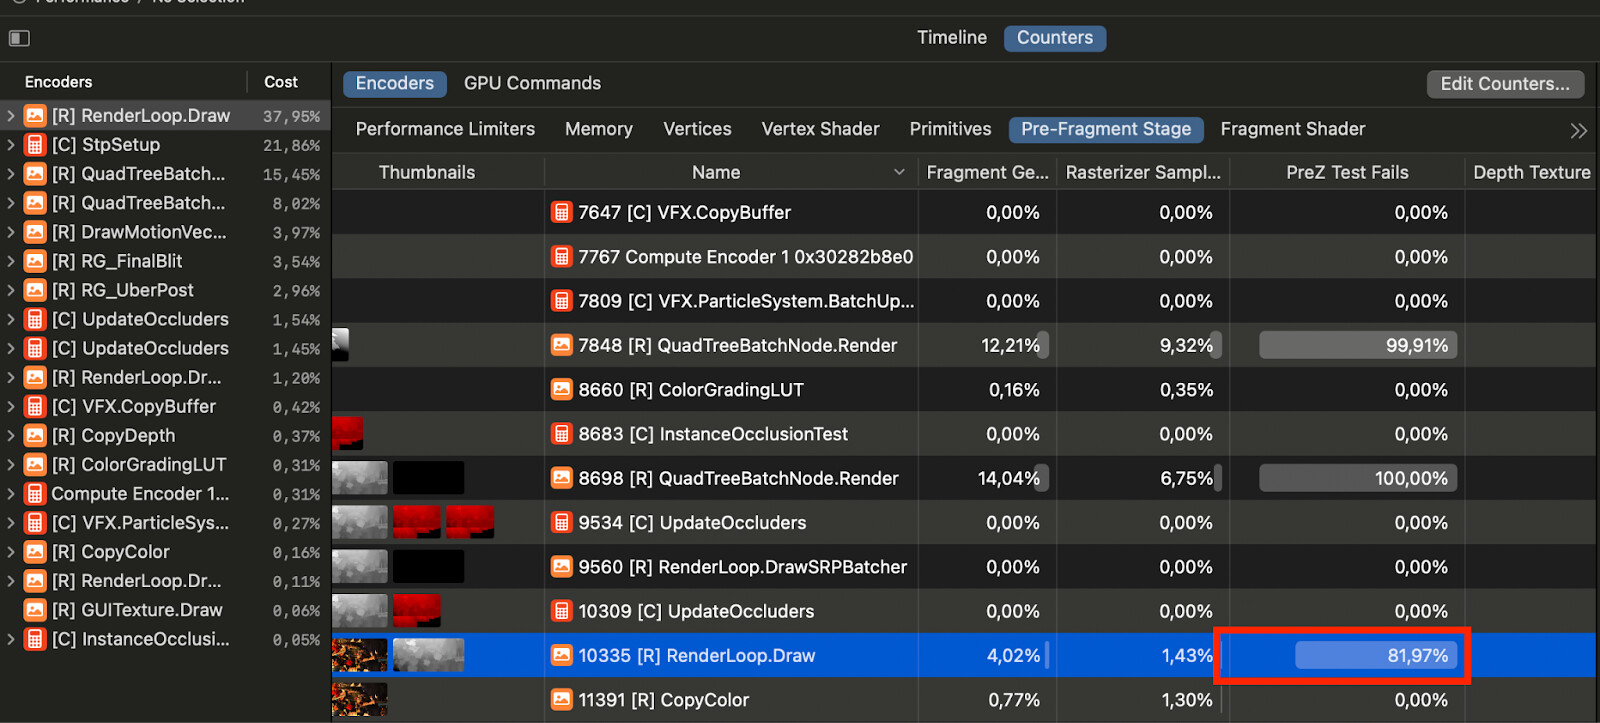
If your render pass has a high pixel overdraw, but it mostly consists of opaque objects, consider checking the ‘PreZ Test Fails’ counter in the Pre-Fragment Stage tab. For the RenderLoop.Draw pass in our frame capture, the PreZ Test Fails value is 81.97%, which means that by far most of the rasterized fragments are discarded before any fragment shader work is performed.
If you see a low value here, but your scene has mostly opaque objects that perform depth testing, check whether alpha clipping has been unintentionally enabled for the shader or material. A common situation where alpha clipping is unintentionally enabled is when using dither transparency to fade objects, for example when intersecting with the camera and player character. In this case, ensure that alpha clipping is only enabled for objects that are currently fading. Use precompile directives and shader keywords to compile multiple variants of the shader, and enable the required shader keyword for the object’s material only when alpha clipping needs to be applied.
The Rendering Debugger in URP and HDRP can visualize overdraw as a heatmap via the Rendering > Overdraw Mode option. This is very practical for quickly identifying overdraw in your scene. Note, however, that this overlay does not account for early Z-testing of objects. In this example, some water effects on the top right side of the frame are causing up to ten times overdraw for the area that they cover.

Dense Geometry and Microtriangles
A very high geometric density for the screen space that a mesh occupies can cause bottlenecks in the rasterization and fragment shading process. This article gives a good explanation of why small triangles are expensive to render. We won’t go into details here, but the simple version is that fragments are processed in 2x2 blocks during the rasterization and fragment shader processes, and if a triangle is smaller than 2x2, all of the pixels in the block are still processed, wasting resources. This also applies to very thin and long triangles, for example a triangle that covers a 1x50 pixel area.
We can get an indication of whether our geometry is too dense in the ‘Pre-Fragment Stage’ tab of the ‘Counters’ view. Here we find that 6.77 fragments are rasterized for each primitive in the RenderLoop.Draw pass. This is a low number, which warrants further investigation, as triangles smaller than 2x2 (4 pixels) are significantly more expensive to rasterize and render. Next, we should identify which draw calls are generating these small triangles.

We can inspect performance counters per draw call by switching to the GPU Commands tab. Here, we can sort draw calls by ‘Fragments Rasterized per Primitive’ to identify which specific draw calls are generating small triangles. Selecting a draw call will highlight it on the left-hand side.

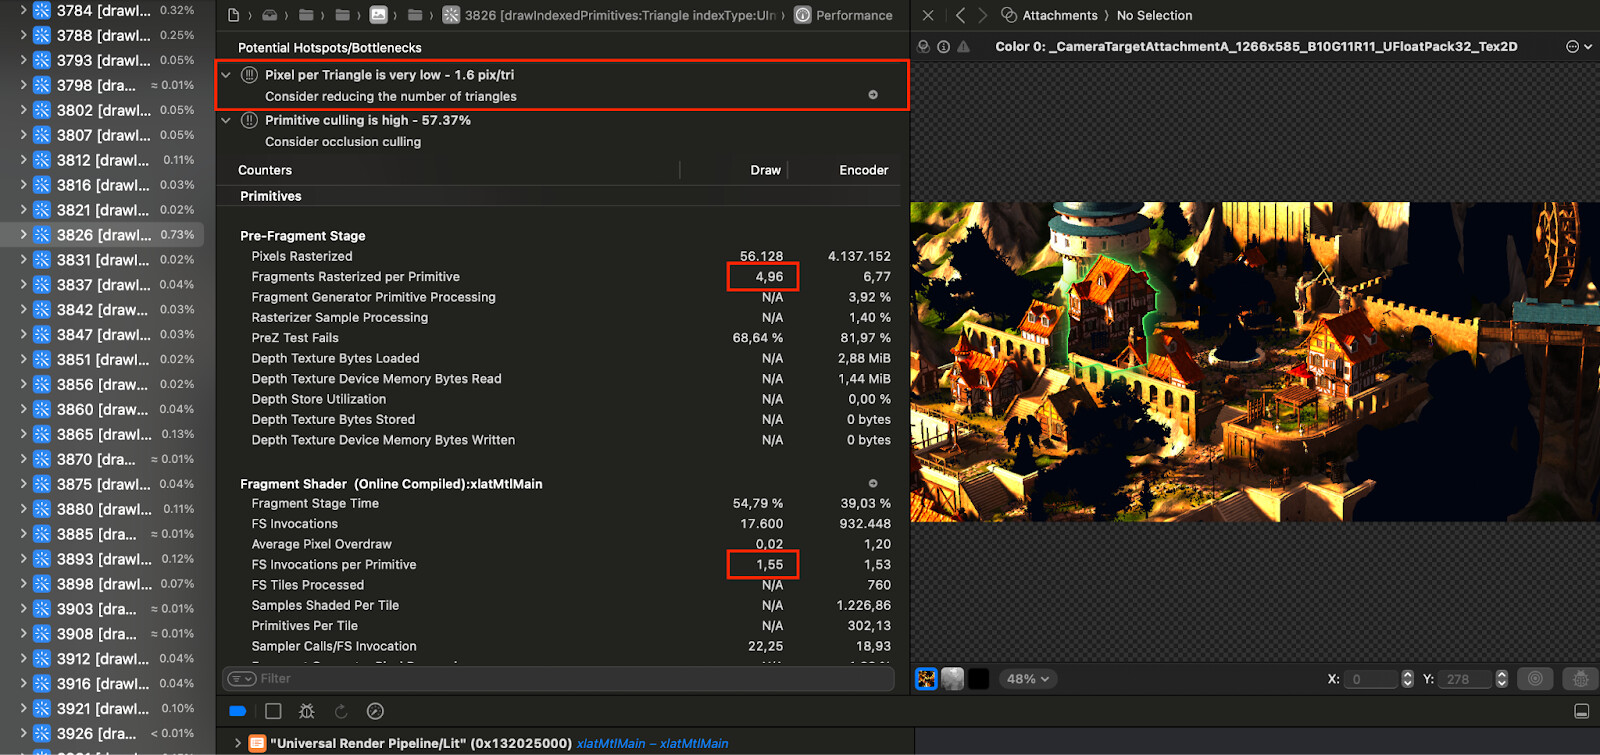
For example, the draw call for a house has 4.96 fragments rasterized per primitive, and after discarding some fragments to early-z tests, we’re only rendering 1.56 pixels per triangle. This number is low enough that Xcode gives us a warning about it.
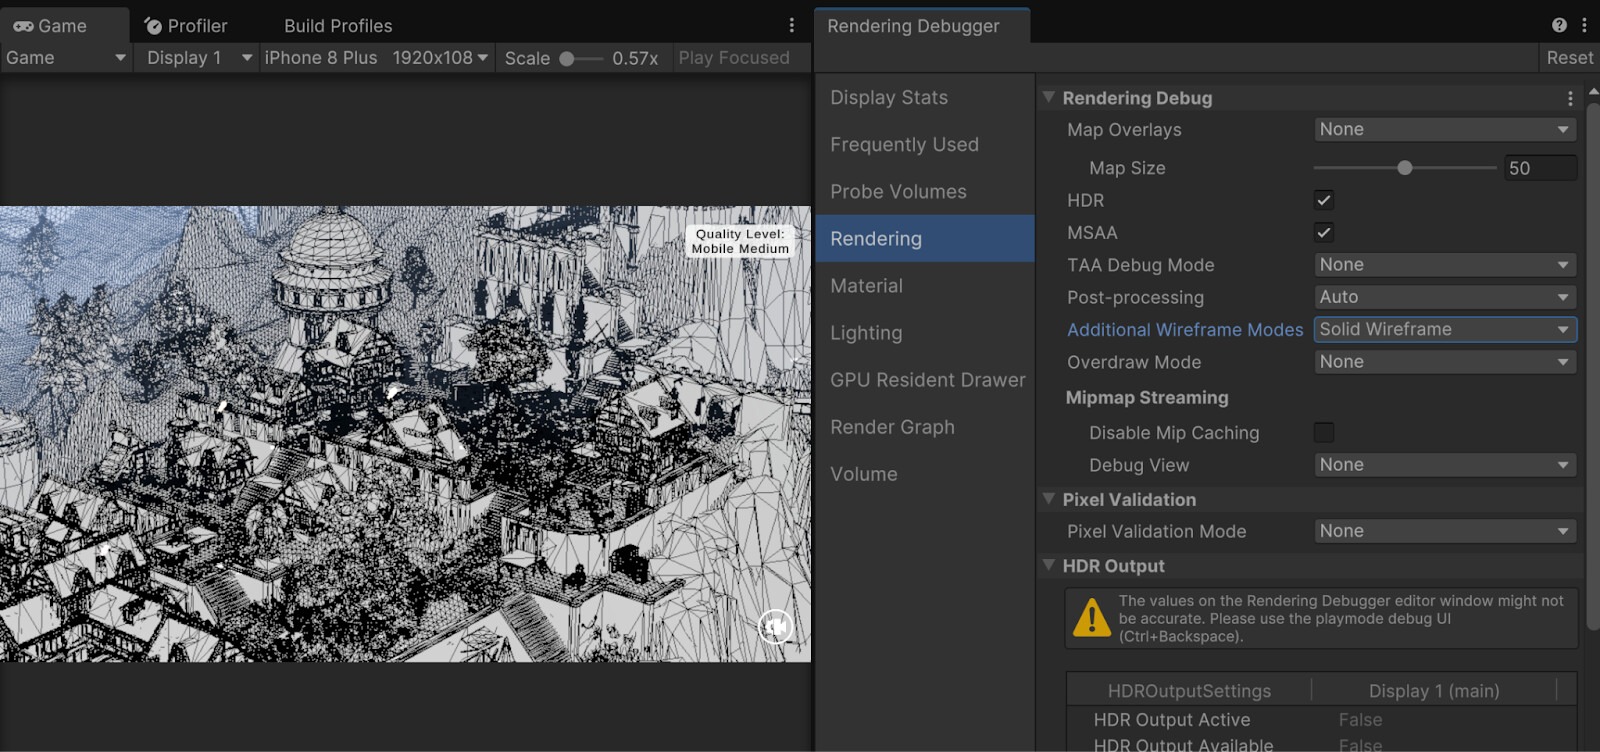
In URP and HDRP, the Rendering Debugger window can show the whole frame as a solid wireframe, giving a more holistic view of the scene’s geometric density. Note that some areas, especially on buildings and trees are especially dense.
The conclusion here is that we are rasterizing many more fragments from our geometry than what will be visible after the fragment stage, which likely impacts the duration of the fragment stage. A common solution to this problem is adding mesh LODs with less complex geometry, and displaying these at higher distances to the camera. As a bonus, simpler geometry should also help in reducing our lengthy vertex stage time.
LODs can be implemented with Unity’s Level of Detail system. The Fantasy Kingdom demo already implements LODs, but these are only enabled at even higher distances to the camera. Check out the demo if you want to see an example of how LODs are implemented!
Fragment Utilization & Limiter Counters
Just like in the vertex stage, several issues in the fragment stage can be identified with utilization and limiter counters in the timeline view. Here are some common counters to look out for, and things to consider if you see a high limiter vs utilization value in these:
ALU: Reduce the number and complexity of math operations:
- Consider whether the shader math can be simplified. Be aware that some shader functions, especially those that relate to trigonometry, don’t have native hardware implementations, and may be much more expensive to process than using dot or cross products. See the following blog post for more information.
- Consider whether textures could replace certain calculations. For example, a noise generation function could be replaced with a noise texture.
- Use data types with lower precision when possible.
Texture Read: Try to reduce the number of texture samples performed in the shader:
- Consider whether multiple grayscale textures could be combined into a single texture that utilizes each color channel. Note that this is only an optimization if all the combined textures are sampled at the same coordinates.
- Reduce texture sizes where possible.
Additionally, the Texture Read counter is a combination of the two following counters, which can also be found in the timeline view. Check each of these to better pinpoint the bottleneck:
-
Texture Read Cache Limiter: A high value here indicates frequent cache misses. This occurs when textures have larger dimensions than the screen space they are projected to. For textures projected on 3D models, ensure mipmaps are enabled, and for textures that are projected on 2D images, try reducing the texture dimensions.
-
Texture Filtering Limiter: Use bilinear filtering rather than trilinear filtering, as the latter also blends between mipmaps.
Texture Write: This counter describes the time spent writing to render targets.
- Reduce the render target size if possible
- If you write to multiple render targets, for example with deferred rendering, consider whether the number of render targets could be reduced.
- Reduce the number of samples for MSAA.
- A high value here can also be an indication of microtriangles. Cross-check with the ‘Fragments Rasterized per Primitive’ counter for the vertex stage, and consider using mesh LODs.
Branching
You may have heard the statement that ‘branching in shaders is bad for performance and should be avoided’. This is true to some extent, but it is important to understand when and why branching in shader programs is bad, and how we can identify whether branching is a bottleneck.
Fragment shader execution is highly parallelized by segmenting fragments into spatial groups. These groups are also called ‘Warps’ or ‘Waves’ depending on the platform. Each group can execute the shader code for all of its fragments in parallel, but only one line at a time, in lockstep. The problem with branching in shaders arises when fragments within the same group need to execute separate sides of the same branch.
Imagine a situation where half of the fragments in a group need to execute one side of an if-statement, while the other half need to execute the other side. When one side of the if-statement is executed, half of the fragment shader threads sit idle, waiting for the other half to finish work. Conversely, if all of the fragments execute the same side of the if-statement, no stalling occurs.
For unbalanced cases where one side of a branch is very complex, and the other is very simple, the compiler will have to assume the worst case: that all fragments will process the complex side. At runtime, we will then allocate enough registers to make this possible, which may result in stalling because not enough registers are available, even when executing only the simple side of the branch.
The same concepts apply to loops with variable iteration lengths. If some fragments need to execute four iterations of a loop, while other fragments need to execute eight, some threads will sit idle until all eight iterations of the loop have been completed. Consider the following example where we apply a simple box blur, but we apply more blur iterations the further away from the camera the fragment is. Neighboring fragments are likely to shift in depth, and therefore it is likely that threads for some fragments within the same group will sit idle, while others are performing work:
float4 color = tex2D(_MainTex, i.uv);
float blurIterations = _BlurIterations * i.vertex.z;

for (int i = 0; i < blurIterations; i++)
{
    float blurDistance = _BlurDistance * i;
    color += tex2D(_MainTex, i.uv + float2(blurDistance, blurDistance);
    color += tex2D(_MainTex, i.uv + float2(-blurDistance, -blurDistance);
    color += tex2D(_MainTex, i.uv + float2(-blurDistance, blurDistance);
    color += tex2D(_MainTex, i.uv + float2(blurDistance, -blurDistance);
}

color = color / (blurIterations * 4) + 1;
In conclusion, you should generally avoid branching if it is likely that fragments within the same spatial group will diverge in their execution path. But keep in mind that the amount of work inside the scope of a branch determines how long some threads might sit idle. Branches with many instructions in their scope might cause a significant performance bottleneck, while very simple branches are likely not a performance issue at all.
One metric that can be used to determine whether branching might impact performance is the ‘FS ALU Inefficiency’ counter in the ‘Fragment Shader’ tab. This metric includes how many ALU instructions were not executed due to branching, and the thread ends up waiting instead.
However, since groups are allocated per primitive, it may also occur that the primitive is too small to occupy all threads of a group. ALU instructions that were discarded for this reason are also included in this metric, so keep in mind that micro triangles may skew this metric.

Conclusion
GPU profiling can be difficult since there are heaps of data available for a single frame capture. Hopefully, this guide provides a starting point for you to analyze GPU performance in depth and be more certain about performance bottlenecks before deciding to implement optimizations. GPU profiling can be approached in a top-down manner, starting with identifying the most expensive render passes of a frame, and then investigating the data available for those passes to detect potential bottlenecks.
The process used in this article can be transferred to other platforms and their respective GPU profiling tools. For example, RenderDoc, PIX, and NVIDIA Nsight Graphics can be used for PC applications. You will find that different GPU profiling software vary greatly in UI and data provided, but the profiling strategy remains the same. Keep in mind that different platforms will likely perform differently too, as the hardware and output resolutions can vary greatly across platforms. So make sure to profile on all the platforms that your game supports!
Please let me know if you have any questions or comments, and thank you for reading!