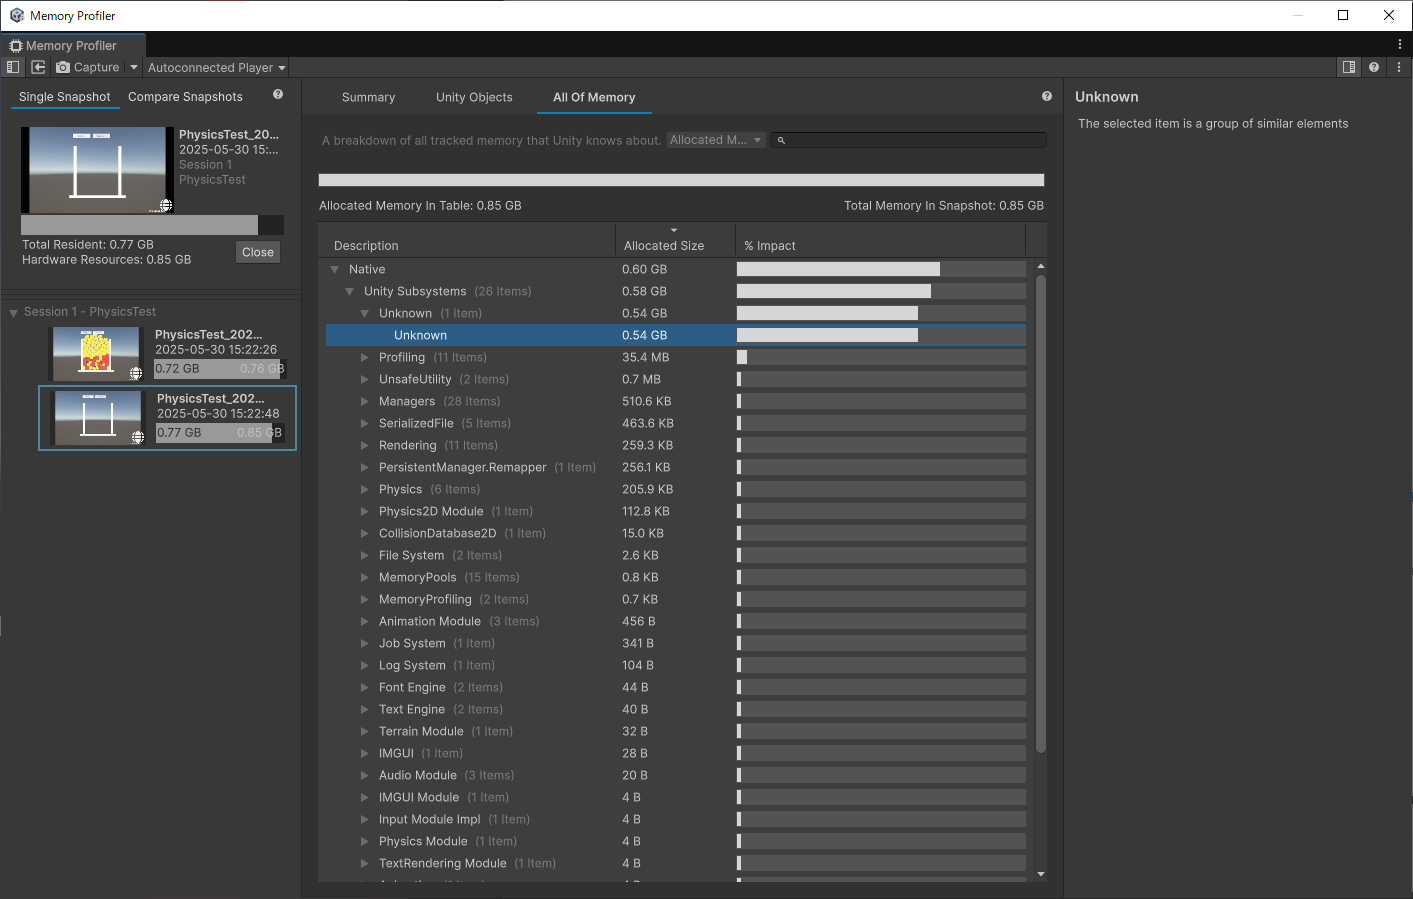
When running Rigidbody physics on WebGL, “Unknown” in the memory profiler keeps increasing.
Even after destroying the Rigidbody, the memory is not released.
Is there a way to free it?
3 Likes
There’s no platform specific code in 2D physics so that would be strange indeed if it were the case. Also, all memory allocated by 2D physics is tagged as such so should show as allocated there. I’m not sure what all that “unknown” is though.
How do you know this is 2D physics related beyond you simply using 2D physics? Is this happening on any other platform? The Editor?
I’d definately suggest submitted a bug report for this so the source of the allocations can be determined.
Disabling the simulated property of the Rigidbody2D prevents the memory increase.
Therefore, I concluded that the issue is related to 2D physics calculations.
The issue was also occurring in the editor.
I have submitted a bug report regarding this issue.
Okay, so WebGL is not related. That would make more sense.
Could you provide me with the case number so I can take a look at this?
Thanks.
The case number is IN-103777.
1 Like
Thanks for the reproduction.
I just wanted to confirm that I can reproduce this in the Editor. No idea what is leaking here but I’ll let you know as soon as I find anything.
I’ve confirmed that this is a memory leak when reporting collision contacts (OnCollisionEnter2D, Stay2D and Exit2D) so not directly related to a Rigidbody2D or WebGL but simply the callback system compiling contacts but not releasing all memory.
It affects 6000.3.0a1, 6000.2.0a10, 6000.1.2f1, 6000.0.49f1, and 2022.3.62f1.
I’ve already got a fix and will try to land it in the next few days so it should be in subsequent releases after they land. You can track the progress here: Unity Issue Tracker - Memory Leak When Using Rigidbody2D Physics in WebGL
My apologies for the problems this is causing but it should be fixed soon.
Note, there’s a huge amount of memory (Gb) being allocated in the reproduction project you submitted but that’s related to the profiler and memory dumps being loaded when you hit play. Closing the profiler will make that go away. Also, in the 2D physics settings you have “Reuse Collision Callbacks” turned off which is on by default; this will cause a lot of GC memory to be allocated although it’s not the cause of the memory leak above which is indeed a bug.
Thanks again for the reproduction case.
7 Likes
Thank you for your prompt response.
I’m looking forward to seeing the fix implemented.
1 Like
All the fix PRs have been reviewed and approved and are waiting to land in the respective release queues.
I’ll post again when they land and I know which release versions they’ll appear in.
2 Likes
All PRs have landed and will be in the following releases:
- 2022.3.64f1
- 6000.0.52f1
- 6000.1.8f1
- 6000.2.0b6
- 6000.3.0a1
Thanks again for the report.
3 Likes
Thank you for the communication. Working on a Metroidvania project and have been wondering about a possible memory leak, but didn’t know where. Wasn’t even sure if it was a 2D physics or something URP related.
We are looking to get an alpha one out just for people to give feedback and ideas on it. We were holding off till we fixed a few things on our side. Knowing the patch that will have the fix allows us to start properly making a timeline for the upcoming weeks of what to focus on and lets us know what the minimum time should be to wait for the release.
1 Like
Yeah, sorry about this issue. I’m also investigating how this leak slipped through the test gauntlet because it should’ve been detected.
1 Like
Hi @MelvMay,
Is the physics team aware of crashes associated with (IN-102844)
PhysicsCommands::Physx::SetScratchBufferChunkCount?
0x00007ffe23e49e98 (Unity) purecall
0x00007ffe217fa1b2 (Unity) PhysicsCommands::Physx::SetScratchBufferChunkCount
0x00007ffe217fbab0 (Unity) PhysicsScene::RequestScratchBufferChunkCount
0x00007ffe212b24f4 (Unity) PhysicsManager::AwakeFromLoad
0x00007ffe2209f194 (Unity) ResetUserEditableManagers
0x00007ffe2216739e (Unity) PlayerLoopController::ExitPlayMode
0x00007ffe22168db0 (Unity) PlayerLoopController::SetIsPlaying
0x00007ffe22163e98 (Unity) Application::TickTimer
Unfortunately I have no idea as I work only on 2D physics and don’t work alongside the 3D physics team but you’re best creating your own thread tagged “Physics” or better still, create a bug report.
Thanks.
EDIT: Found your original post and sent a link to their channel but that’s all I can do. TBH, whilst I’m not a pipeline to the 3D physics team and I appreciate bugs are frustrating, a DM is preferred over hijacking an important thread. Thanks.
2 Likes
I was having this issue and I can confirm it is now fixed after going from 6000.1.6 to 6000.1.9. It was present in the editor and in Windows builds as well. My “Physics Used Memory” was slowly rising forever. So I’m glad it’s fixed.
The bads news: I blew 2 days of work hunting this down before I found this thread. =/
Is there a plan/timeframe to have a fix for this issue in a non-enterprise version of Unity??
I have no control over that unfortunately but have raised the subject internally. I am surprised it wasn’t raised earlier above, I was only made aware of this yesterday unfortunately.
They just released the update that fixes this issue: Unity 2022.3.62f3
1 Like