Because this happens, could you tell me why?


First of all, for this kind of thing, make sure you’re profiling the actual build, and not the editor. The results can be very different.
Two of the screenshots seem like you’re activating a GameObject on that frame, resulting in a big framerate drop when the object is first activated. That’s normal. You shouldn’t expect to activate game objects for the first time at run time without incurring some initialization cost. Depending on your specific situation, you could activate the object when the scene first loads, deactivate it a frame later, and then reactive it when you actually need it. That might help front-load the bulk of the initialization cost.
strange because I do just that, but this is giving those fps drops.
I do an active disabling and activating objects and I put a wait of 0.2 between them, I’d know some other way of not using the coroutine?
Without more context it is quite tough to tell you, what the problem is or how to solve it. Too me it looks like the profiler is already telling you, where the problems are.
So without further context, we can only give you rough hints:
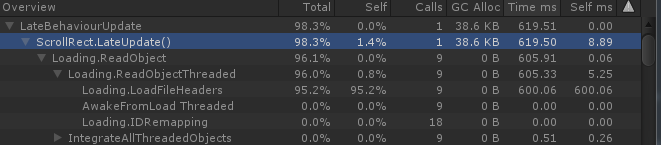
Screenshot 1:
Looks like you have a scroll rect in your UI (?) that intializes and loads some data for 9 assets (?) from file at 600 ms total or ~ 66ms each. Without knowing what or how you’re loading it there, it is kind of impossible to tell you how to optimize this. Maybe there is a way to load these things async, through a scene, and somehow hide or stagger that loading so it is less obvious.
Screenshot 2:
I’d deep profile that to figure out where that FindObjectOfType is coming from. If it is from your code, try setting up references in the editor instead of collecting them at run time. if it is our uGUI code, try to reduce the complexity of the canvas and it’s hierarchy and maybe the seen so that lookup might get faster. Maybe you have too many text elements, too many different fonts that need caching. 52 calls sounds excessive. Are you using TextMeshPro? if not, you probably should.
If all of this fails, try loading that canvas once, show it while hidden behind a loadingscreen. Maybe even keep it around as disabled if you’d be getting that hit again everytime you recreate it. same goes for Screenshot 1 btw. If you can take the hit this will have on your memory watermark, take it, if you’d rather have a higher watermark but smoother transitions/ no hitches.
Screenshot 3
Looks like all the time is spend setting up the animator. Maybe it is overly complex and could get reduced? if not, hide the initial activation behind a loading screen.
also chechout the Unite talks regarding performance optimization like this one:

there might be some good learnings in there that you could apply here.