Hi,
I am experiencing what seems to be some unexplained GPU spikes.
In this example, the CPU is running fast (around 5ms) with the rest of the frame waiting for target FPS.
The GPU runs continuously fast most of the time, apart from the occasional frame where it will spike massively, with seemingly no explanation. The GPU profiler shows it doing the same tasks and draw calls, with the time just being lost.
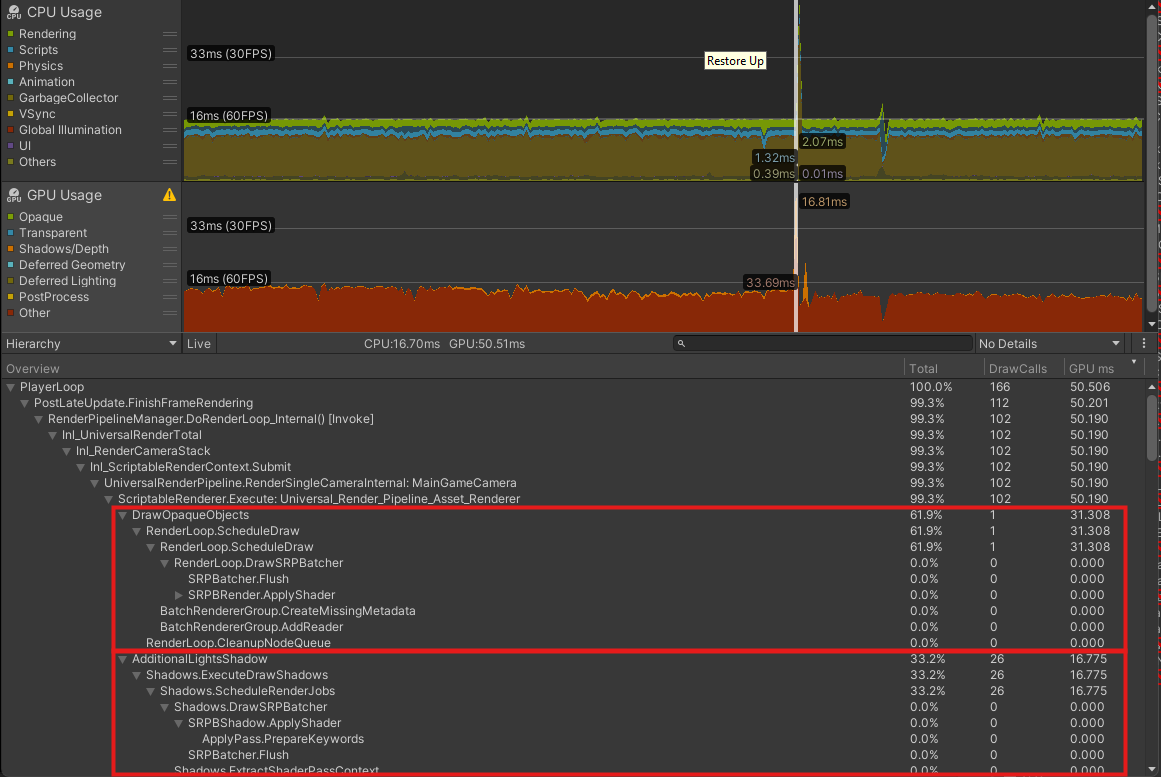
Please see this frame capture. The spike shows DrawOpaque and AdditionalLightsShadow shoot up for a single frame and then go back to normal, but it doesn’t show anything different to the previous frames. This is not always consistent either, sometimes it can be DepthNormalPrepass that shoots up and others normal.
I’m looking for signs of shader compilation but can’t see anything obvious (and we are calling WarmupAllShaders after loading). The CPU frame is normal on that frame, and then of course the subsequent frame is spiked just waiting for the GPU.
So what this looks like is the actual GPU stalling for some reason. And this occurs on many different machines, not just mine. It also occurs on Unity 6.
If anyone has any thoughts I’d very much appreciate it.
Thanks.
Is there anything suspicious going on in other threads at the same time this is happening? A more thorough exploration would probably be necessary but, I’ve come across a project with a seemingly erratic spike behaviour like this and it was a random network action happening in a thread doing this, linked to analytics. It’s sometimes rather hard to find, though, even with the profiler. So you can check your project / player settings if any stuff like that (analytics) is enabled and shouldn’t. Depending if your project was upgraded from an older version of Unity… this might even need an exploration of the project settings YAML file with a a text editor 
But again, this is more a wild guess and a more serious look at the profiler data would be necessary.
It’s a bit hard to tell with the cursor right on top of the spike but it looks like your Garbage collector is kicking in. What version of Unity are you using? Starting with 2020 (I think? Been a long time) a new option was added in the project settings under Player->Configuration. It is labeled ‘Use Incremental Garbage Collector’. This is usually enabled by default in newer versions of Unity but if you are using an older version it might be off or entirely missing.
EDIT: Taking a closer look it seems like you probably already have it enabled because the CG is running pretty much all of the time. Plus the timing for the rendering frame is pretty crazy high.
Hi, thanks very much for the replies.
I’m still struggling with this one.
I have tried everything, I’ve removed everything we are doing that is remotely complicated. I’ve disabled all our graphical effects. I’ve even disabled all lights in the scene. And it still occurs.
To clarify, this is not a random spike, I can reproduce it consistently with a single camera pan that views a new part of the scene. I know it’s not garbage collection, and I see nothing causing the spike on any of the threads. The only thing I am seeing is the GPU spiking.
Thank you for the suggestion of looking through the Project Settings YAML. Our project has been updated from a very old version of Unity so it was entirely possible something in there was causing it. I diffed it with a clean version from a clean project and although there were a few potential settings remaining (such as the old dynamic batching setting) none of them seem to have changed anything
I do wonder if it could still be shader related but we are prewarming all shaders, and have even tried creating a shader variant collection for that specific area and warming that way too. Current thoughts are to look at Wwise in case it’s causing a spike on a hidden thread somehow.
I have tried a PIX capture and I’m not sure I’m seeing anything different (though I’m not overly familiar with it). I may try Nsight next.
If you have any further thoughts please let me know.
Thanks.
Just an update on this as we have found the cause of the issue.
It seemed to be uploading textures to the GPU. Our VRAM usage was excessive and it seems Unity must do some memory management even though texture streaming was disabled.
We have managed to solve the issue by setting up texture streaming.
Thanks for the replies, hopefully this may help someone else down the line.
Worth mentioning that this was very difficult to track down with seemingly no indication of it from the Unity side at all. An external profile with NVidia Nsight showed something uploading to the GPU, and then only by trialling a clamping of max texture size did it become apparent that this was the problem. I checked the Unity profiler and the loading threads were not showing anything at all. Maybe there was something else that would have pointed me to it had I known where to look?
Thanks