GC doesn’t mean garbage, it means garbage collector, meaning there’s a system that collects garbage, meaning you don’t have to do it manually (and in almost all usual circumstances shouldn’t).
If you’re low on memory and you need a magic function, sometimes it helps calling Unity - Scripting API: Resources.UnloadUnusedAssets at certain points where a slight delay won’t be noticable.
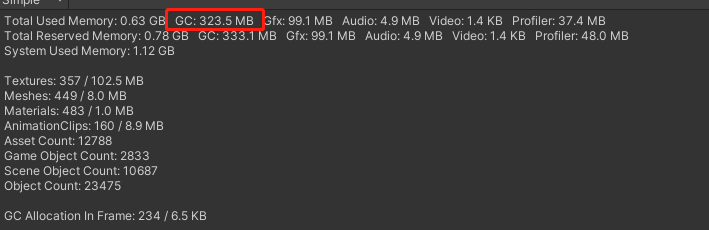
The GC stat is explained in the Memory Profiler Module documentation too and yes, it isn’t garbage memory, it is managed heap memory, i.e. that part of memory used for managed allocations that are being monitored by the GC (Garbage Collector).
That whole Memory Profiler Module UI was a bit unclear so in 2021.2 this hopefully got clarified a bit further . Also, If you take a snapshot with the Memory Profiler Package, you can see exactly what Managed objects are sitting on your managed heap. In the Memory Profiler Package you can also check out the Memory Map, which shows you managed memory regions. In 0.2.10 of the package, this map doesn’t yet mark memory sections used purely by the scripting Virtual Machine as any different than Heap Memory Sections but that will change with version 0.4.0 that we’ll hopefully be able to release this month. Without this differentiation, its a bit tricky to see which sections contribute towards GC Used but basically, the Virtual Machine memory sections don’t, all others do, regardless of the actual usage via objects within these sections.
So:
GC.Collect would only remove managed objects from the heap that are no longer referenced.
If removing them means that the memory blocks they resided in are empty, than they can be reused for new allocations or will eventually (currently every 6th GC.Collect, but that’s implementation specific and shouldn’t be relied upon) be returned to the OS (lowering the GC Used stat)
If there are blocks that are not fully empty, some of that space might be reused for new allocations but that depends on new allocations actually fitting into that space. If they don’t and you don’t have any use for memory bits of that size, this memory is too fragmented for your use. In that case, these blocks are basically wasting managed heap space for you due to fragmentation.
This can currently be somewhat inspected in the Memory Map and will be improved, both by the release of 0.4.0 of the package and future changes we have planned. Fragmentation might not be your actual problem so, maybe just start looking at your Managed Memory usage by taking a snapshot with the Memory Profiler Package (the Memory Profiler Module doesn’t record any details on Managed objects, only Native ones).