Performance issue in postprocessing when enabling RenderGraph

Hi,

we recently switched using unity 6 on our test project, and noticed a performance issue when activating RenderGraph support in the graphic settings.

To give some context, we are working on XR projects, the hardware being the Quest2. Projects are developped using URP, and we decided to enable the postprocessing stack on our project to handle some of the light postprocess that are available by default (color lookup, etc).
We are used to analyse rendering data with renderdoc (the meta fork edition) to investigate if we are using postprocessing that would be overbudget or not.

What we are used to see in renderdoc is the following (with the post processing stack enabled, and no post process being applied) :

Our rendering consists of one surface computed that corresponds to the scene rendering, followed by another surface which is the post processing pass being applied to the image.

If I zoom-in on one bin computed for the post processing pass, it looks like this :

This ends up being the same operations on unity 2022 LTS, and Unity 6 (with compatibility mode enabled).

Now when we activate rendergraph support, we noticed a severe performance drop in the application; turns out the gpu is not even running at its maximum, but the application is barely rendering at the target fps.

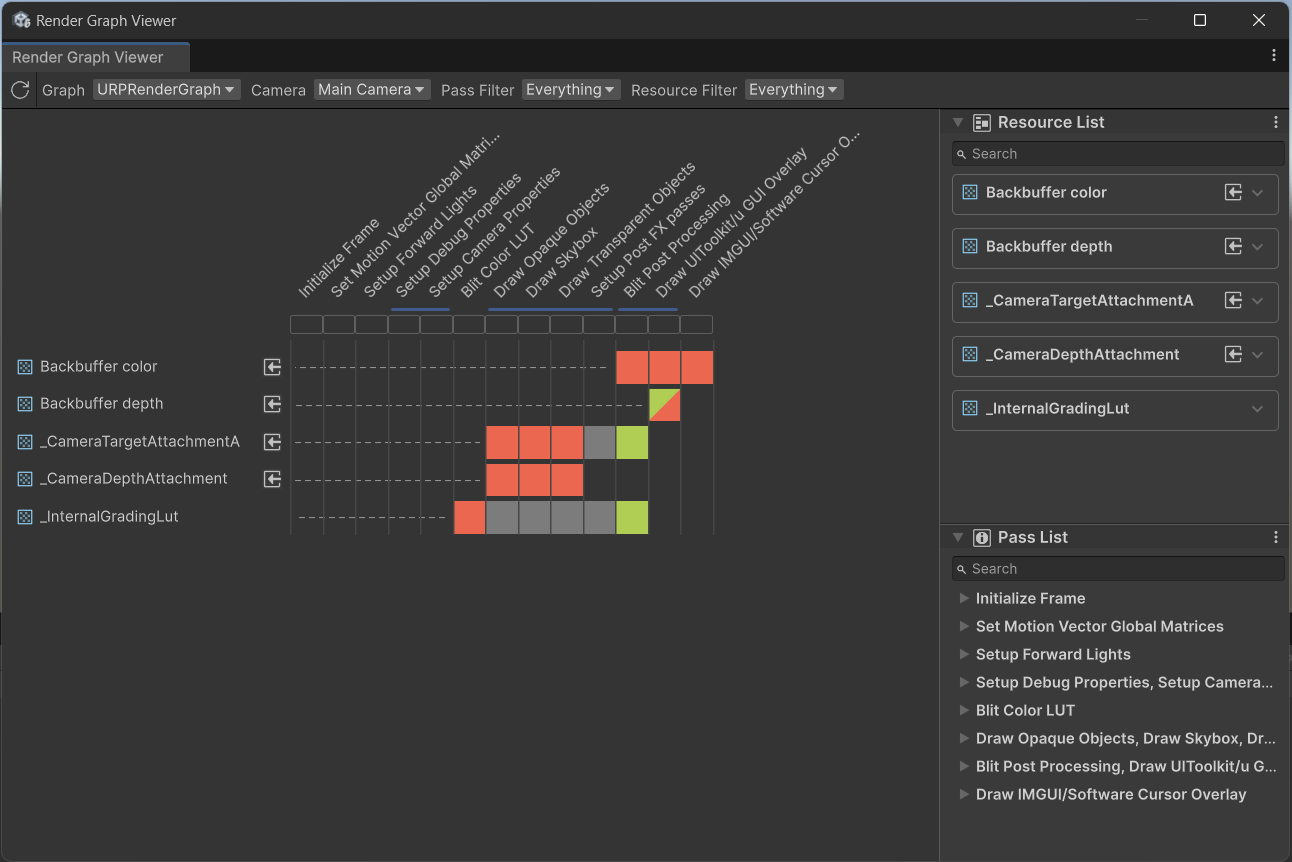
Investigations with renderdoc shows this kind of behaviour :

And if I zoom-in on one bin being executed at post processing time, it looks like this :

The operations have drastically changed between the two, the difference only being the activation of rendergraph support. Rendering post-processing now implies executing two load operations; I suspect that in this scenario, the hardware is doing a lot more memory transfers during rendering, but my knowledge of what is happening at that time is pretty limited.

These results are observed on unity 6000.0.30f1; using latest version of unity (6000.0.37f1) did show similar results.

So for now, things are ok on our projects since we have the possibility to run in compatibility mode;
still, does anyone know what is happening under the hood that would explain the difference of behaviour in rendering ?

Also, I’m concerned regarding the future of our development; at some point, the compatibility mode is going to disappear, rendergraph workflow becoming the default behaviour; can we consider that the difference in performance we are observing is related to an issue in the rendering, or are we looking at a different level of performance that is going to be the standard in future releases ?

Thanks for the help,

To confirm my understanding, post processing is on on the camera and renderer, but all effects are turned off? So there should be no post processing applied? Turning off post processing solves this?

And in Comp mode, there is actually no PP applied? While in RG mode there seems to be a PP pass that triggers the load>render>store that you see?

Can you share a screenshot of RenderGraph Viewer with these settings?

No, RenderGraph should have the same or better performance.

Hi,

thanks for your answer;

To give you more details on the configuration :

  • the camera has the option “Post processing” enabled, yes;
  • as per the new unity 6 convention, there is a default profile volume assigned in the graphics settings; this volume has the settings set to default values
  • universal render data has the option “enabled” ticked on post processing
  • universal render pipeline asset has a volume profile assigned, with no overrides setup in the volume
  • MSAA is active at 4x value, in case this has an influence on what is happening on rendering
  • Also I made sure that the project has only one quality level available in order to avoid any issue with settings not being applied on all the platforms

So in the end, post processing is setup in the rendering, but has no effects applied.

Here is what is shown in the render graph viewer regarding this setup :

In compatibility mode, the post process pass is happening in the trace captured with renderdoc; this is the behaviour we have been used to since we started profiling in unity 2022.

In rendergraph mode, the post process pass is also happening, but the steps load/render/store operations are very different.

While having a closer look at the steps being executed inside a bin, I noticed that the steps are also different during the rendering step; if that can be of any help, here is what renderdoc shows us in compatibility mode :

While in rendergraph mode, the results are the following :

Thanks for having a look at our case, and being reassuring regarding future performance.

Hi, would it be possible to provide a RenderDoc capture? We would prefer it to be on Quest 3 if you have one.

Thanks!!

Hi;

sure, you will find attached two renderdoc captures, one done in rendergraph mode, the other done in compatibility mode :

renderdoc traces.zip (5.1 MB)

The captures were done on quest 3, using latest renderdoc v68.2.

Let me know if you need anything else.

Thanks,

Hi,

did you find anything interesting in the renderdoc traces ?

I went up to have a fully populated project with 3D assets and a few postfx in place; on Quest3, I noticed that the scene is running at 85% GPU load (Level 4) in compatibility mode, while switching to rendergraph mode raises GPU load to 95%, so the impact is quite noticeable.

Let me know if I can be of any help,

Thanks